. 2016 Jul 19;113(29):8049-56.
doi: 10.1073/pnas.1601081113.

Geogenetic patterns in mouse lemurs (genus Microcebus) reveal the ghosts of Madagascar's forests past

Affiliations

Geogenetic patterns in mouse lemurs (genus Microcebus) reveal the ghosts of Madagascar's forests past

Anne D Yoder et al. Proc Natl Acad Sci U S A. .

Abstract

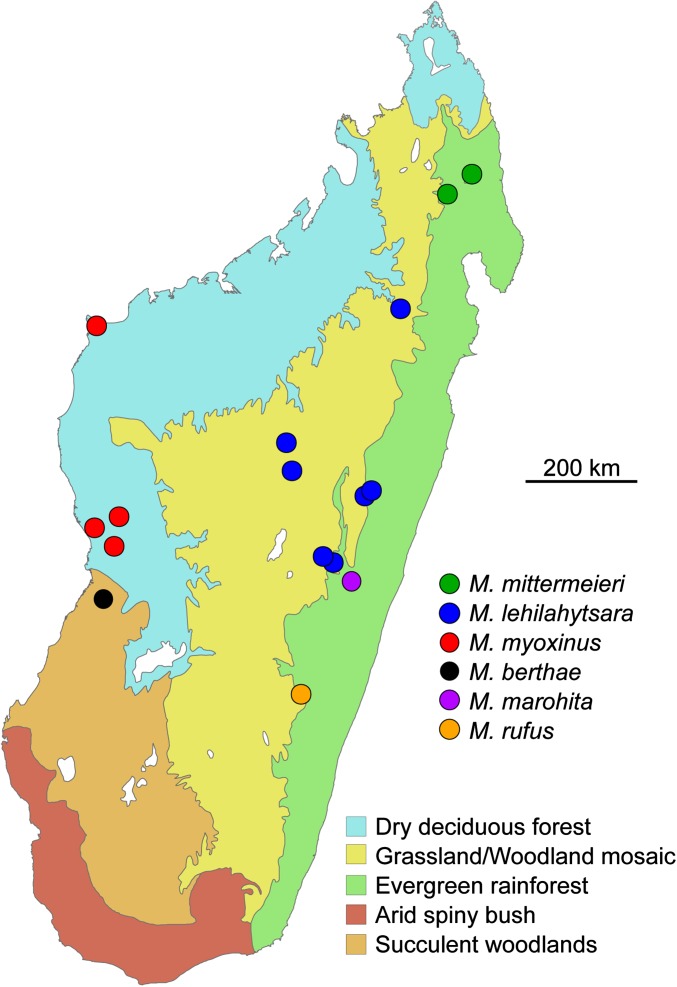
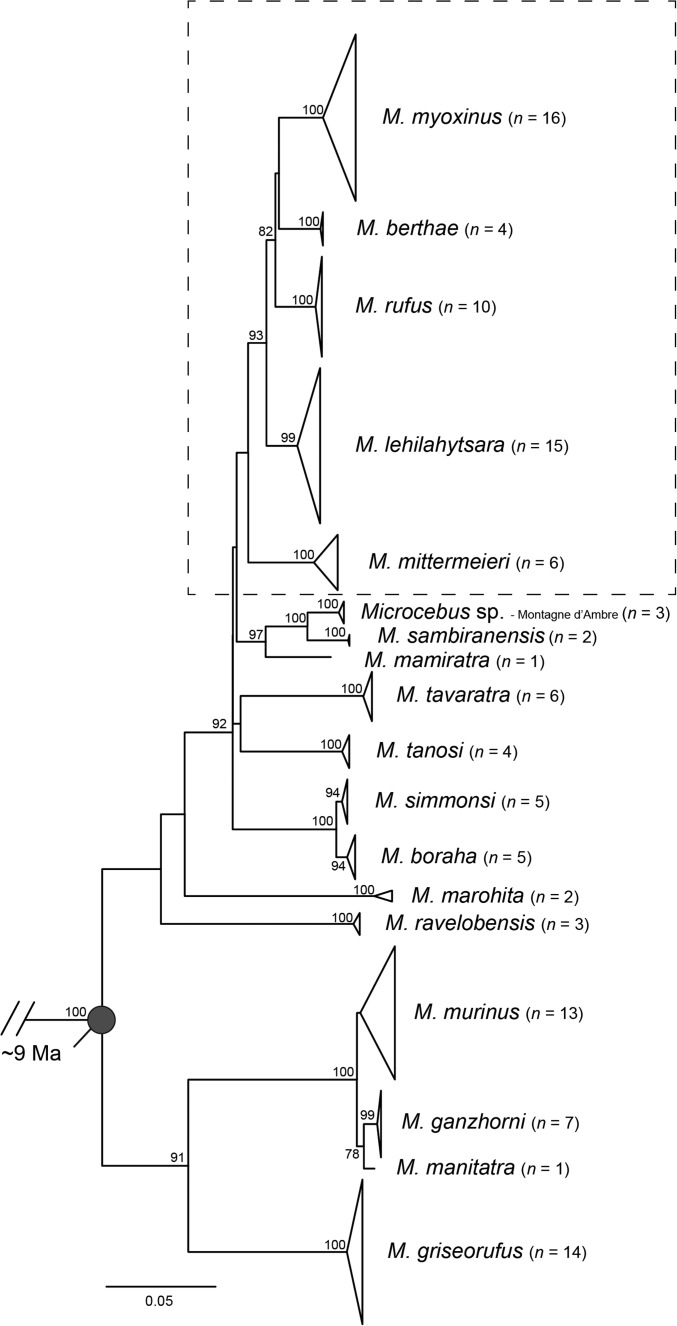
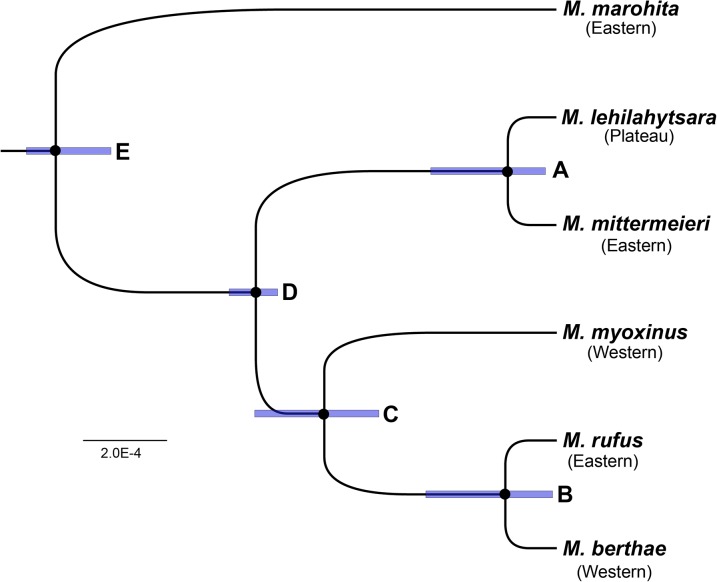
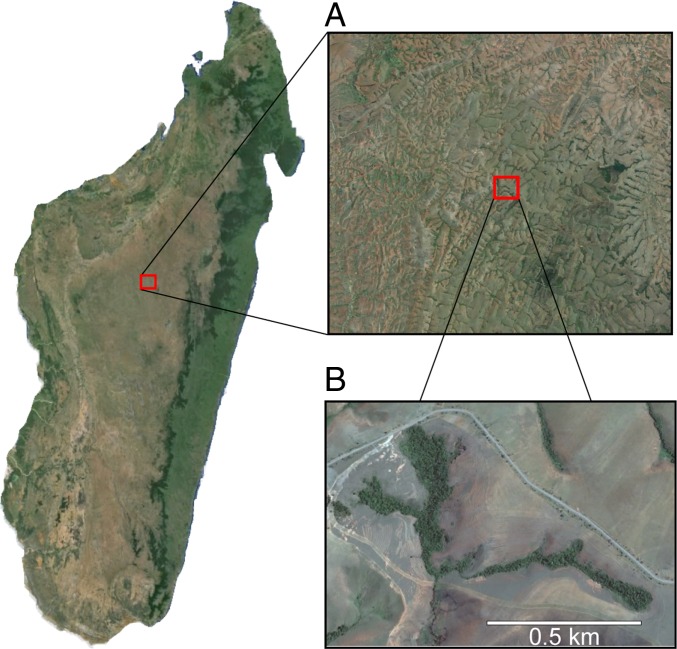
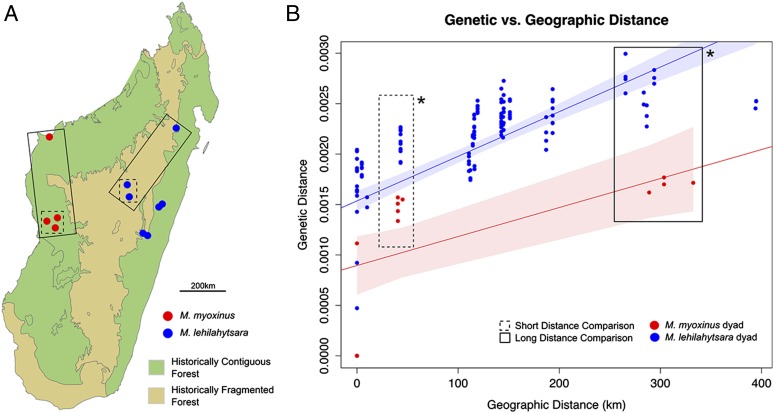
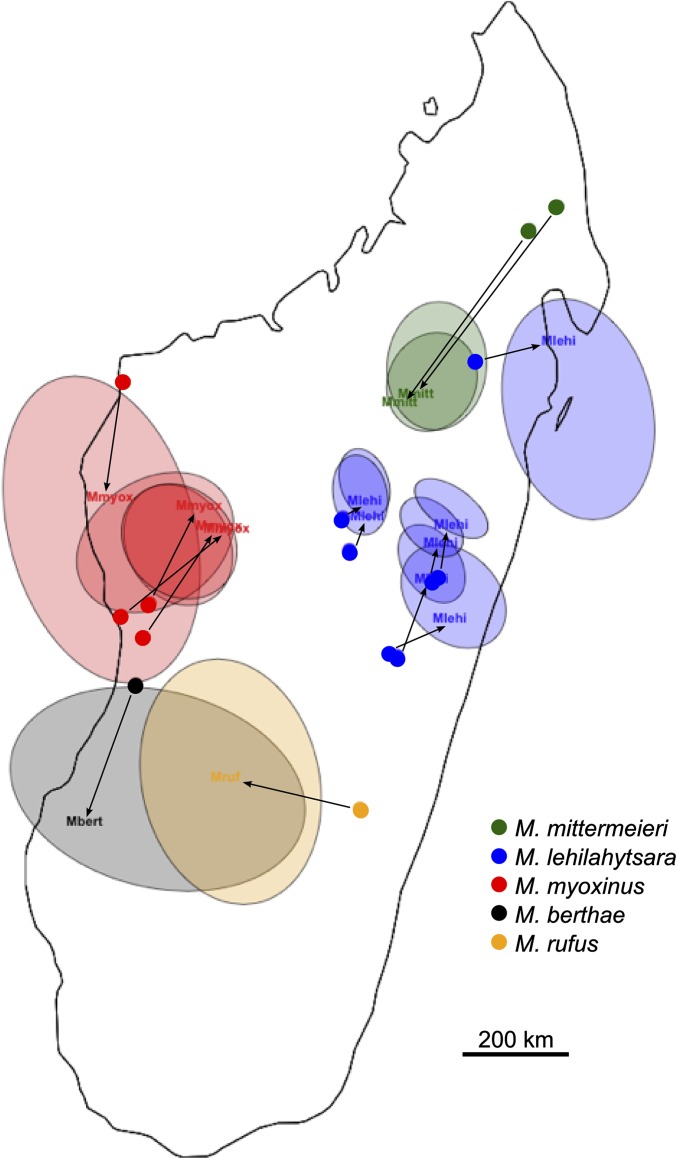
Phylogeographic analysis can be described as the study of the geological and climatological processes that have produced contemporary geographic distributions of populations and species. Here, we attempt to understand how the dynamic process of landscape change on Madagascar has shaped the distribution of a targeted clade of mouse lemurs (genus Microcebus) and, conversely, how phylogenetic and population genetic patterns in these small primates can reciprocally advance our understanding of Madagascar's prehuman environment. The degree to which human activity has impacted the natural plant communities of Madagascar is of critical and enduring interest. Today, the eastern rainforests are separated from the dry deciduous forests of the west by a large expanse of presumed anthropogenic grassland savanna, dominated by the Family Poaceae, that blankets most of the Central Highlands. Although there is firm consensus that anthropogenic activities have transformed the original vegetation through agricultural and pastoral practices, the degree to which closed-canopy forest extended from the east to the west remains debated. Phylogenetic and population genetic patterns in a five-species clade of mouse lemurs suggest that longitudinal dispersal across the island was readily achieved throughout the Pleistocene, apparently ending at ∼55 ka. By examining patterns of both inter- and intraspecific genetic diversity in mouse lemur species found in the eastern, western, and Central Highland zones, we conclude that the natural environment of the Central Highlands would have been mosaic, consisting of a matrix of wooded savanna that formed a transitional zone between the extremes of humid eastern and dry western forest types.

Keywords: climate change; ddRAD; deforestation; phylogeography; speciation.


Conflict of interest statement

The authors declare no conflict of interest.

Figures

Fig. 1.
Fig. 1.
A map of Madagascar with the major biome types recognized in modern times and sampling locations used in this study for all 30 samples across six species within the genus Microcebus. Sampling counts at a given location varied between one and three individuals.
Fig. 2.
Fig. 2.
Maximum likelihood tree for concatenated mtDNA data (cytb and cox2) from 117 Microcebus sequences plus four outgroup sequences (Cheirogaleus and Mirza; not shown in figure). Bootstrap support is shown for internal nodes (100 replicates). The age of the basal node was previously estimated using phylogenetic methods by Yoder and Yang (48). The dashed box highlights the five species targeted for genome-wide SNP analysis.
Fig. 3.
Fig. 3.
Maximum clade credibility species tree from a BPP analysis of nuclear RAD-seq data. Node labels correspond to those in Table 1. All nodes in the tree have 100% statistical support. Blue bars are the 95% highest posterior densities of node heights. Species are identified by their contemporary geographic range (eastern versus western); plateau, Central Highlands plateau.
Fig. 4.
Fig. 4.
Google Earth view of the Ankafobe sampling locality for M. lehilahytsara. Inset A illustrates the depauperate environment that currently is comprised of anthropogenic grasslands. Areas of green are largely comprised of rice cultivation but suggest the potential for naturally occurring forests along these stream basins. Inset B illustrates the extremely isolated position of the Ankafobe Reserve.
Fig. 5.
Fig. 5.
(A) A map of Madagascar with sampling locations for two focal species, M. myoxinus and M. lehilahytsara, hypothesized historical forest type labeled by color, and boxes marking the sampling locations used for short and long geographic distance t tests of genetic distance. (B) Plot of genetic distance versus geographic distance in within-species dyads, colored as on the sampling location map. The dashed and solid boxes on both the distance plot and sampling map illustrate the short and long geographic distance comparisons of genetic distance being made. The t tests within each box are significantly significant at the P < 0.01 level (Figs. S1–S3). The line of best fit and shaded 95% confidence interval, plotted with R, are matched to the species by color.
Fig. S1.
Fig. S1.
Histogram of the P value distribution from 1,000 paired t tests of genetic distance between all long-distance M. myoxinus dyads and a randomly selected set of long-distance M. lehilahytsara dyads. The vertical red line labels the mean P value: 9.80 × 10⁻⁴.
Fig. S2.
Fig. S2.
Short-distance P values. Histogram of P value distribution from 1,000 paired t tests of genetic distance between all short-distance M. myoxinus dyads and a randomly selected set of short-distance M. lehilahytsara dyads. The vertical red line labels the mean P value: 8.59 × 10⁻³.
Fig. S3.
Fig. S3.
Combined distance P values. Histogram of P value distribution from 1,000 paired t tests of genetic distance between all M. myoxinus dyads and a randomly selected, distance-matched set of M. lehilahytsara dyads. The vertical red line labels the mean P value: 1.34 × 10⁻⁴.
Fig. 6.
Fig. 6.
SpaceMix-inferred geogenetic locations of samples based on prior of true sampling site and population consolidated SNP data. Abbreviated names indicate the geogenetic location, and ellipses represent 95% CI of geogenetic location. The true sampling site is labeled with a colored dot, and arrows indicate direction of geographic pull via admixture.

Similar articles

Cited by

References

    1. Myers N, Mittermeier RA, Mittermeier CG, da Fonseca GAB, Kent J. Biodiversity hotspots for conservation priorities. Nature. 2000;403(6772):853–858. - PubMed
    1. Vences M, Wollenberg KC, Vieites DR, Lees DC. Madagascar as a model region of species diversification. Trends Ecol Evol. 2009;24(8):456–465. - PubMed
    1. Callmander MW, et al. The endemic and non-endemic vascular flora of Madagascar updated. Plant Ecol Evol. 2011;144(2):121–125.
    1. Samonds KE, et al. Imperfect isolation: Factors and filters shaping Madagascar’s extant vertebrate fauna. PLoS One. 2013;8(4):e62086. - PMC - PubMed
    1. Wilmé L, Goodman SM, Ganzhorn JU. Biogeographic evolution of Madagascar’s microendemic biota. Science. 2006;312(5776):1063–1065. - PubMed

Publication types

Substances

LinkOut - more resources