

Comparative phylogeography of oceanic archipelagos: Hotspots for inferences of evolutionary process
- PMID: 27432948
- PMCID: PMC4961166
- DOI: 10.1073/pnas.1601078113
Comparative phylogeography of oceanic archipelagos: Hotspots for inferences of evolutionary process
Abstract
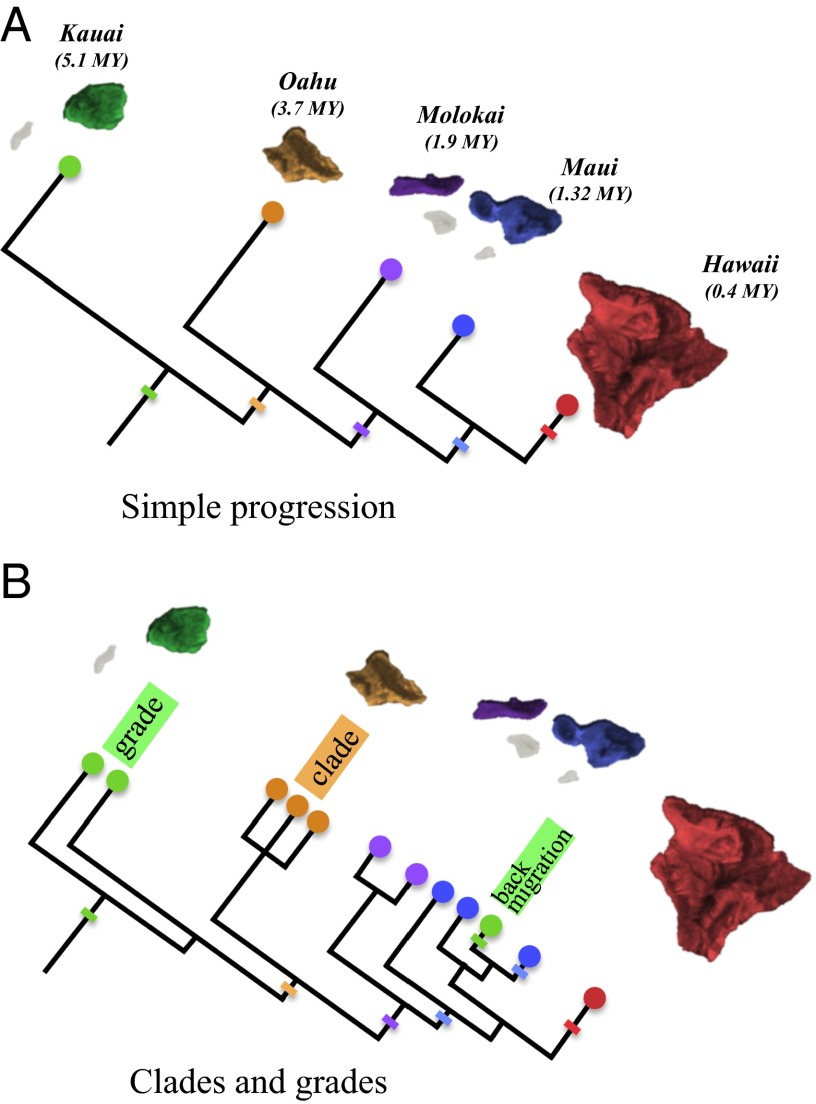
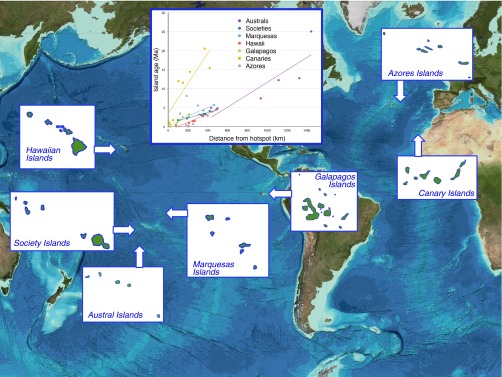
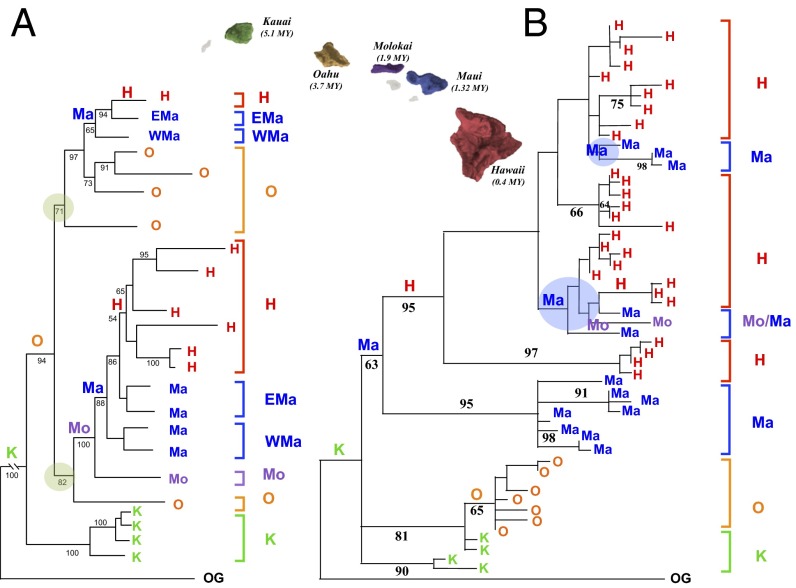
Remote island archipelagos offer superb opportunities to study the evolution of community assembly because of their relatively young and simple communities where speciation contributes to the origin and evolution of community structure. There is great potential for common phylogeographic patterns among remote archipelagos that originate through hotspot volcanism, particularly when the islands formed are spatially isolated and linearly arranged. The progression rule is characterized by a phylogeographic concordance between island age and lineage age in a species radiation. Progression is most likely to arise when a species radiation begins on an older island before the emergence of younger islands of a hotspot archipelago. In the simplest form of progression, colonization of younger islands as they emerge and offer appropriate habitat, is coincident with cladogenesis. In this paper, we review recent discoveries of the progression rule on seven hotspot archipelagos. We then discuss advantages that progression offers to the study of community assembly, and insights that community dynamics may offer toward understanding the evolution of progression. We describe results from two compelling cases of progression where the mosaic genome may offer insights into contrasting demographic histories that shed light on mechanisms of speciation and progression on remote archipelagos.
Keywords: community assembly; priority effect; progression rule; radiation zone; speciation.
Conflict of interest statement
The authors declare no conflict of interest.
Figures
Similar articles
-
Comparative phylogeography of endemic Azorean arthropods.BMC Evol Biol. 2015 Nov 11;15:250. doi: 10.1186/s12862-015-0523-x. BMC Evol Biol. 2015. PMID: 26559388 Free PMC article.
-
Equilibrium Bird Species Diversity in Atlantic Islands.Curr Biol. 2017 Jun 5;27(11):1660-1666.e5. doi: 10.1016/j.cub.2017.04.053. Epub 2017 May 18. Curr Biol. 2017. PMID: 28528903
-
Archipelago-Wide Patterns of Colonization and Speciation Among an Endemic Radiation of Galápagos Land Snails.J Hered. 2020 Feb 5;111(1):92-102. doi: 10.1093/jhered/esz068. J Hered. 2020. PMID: 31841140 Free PMC article.
-
Island biogeography: Taking the long view of nature's laboratories.Science. 2017 Sep 1;357(6354):eaam8326. doi: 10.1126/science.aam8326. Science. 2017. PMID: 28860356 Review.
-
Oceanic island biogeography through the lens of the general dynamic model: assessment and prospect.Biol Rev Camb Philos Soc. 2017 May;92(2):830-853. doi: 10.1111/brv.12256. Epub 2016 Feb 29. Biol Rev Camb Philos Soc. 2017. PMID: 26923215 Review.
Cited by
-
The sweet tabaiba or there and back again: phylogeographical history of the Macaronesian Euphorbia balsamifera.Ann Bot. 2024 May 10;133(5-6):883-904. doi: 10.1093/aob/mcae001. Ann Bot. 2024. PMID: 38197716 Free PMC article.
-
A Revised Phylogenetic Classification for Viola (Violaceae).Plants (Basel). 2022 Aug 27;11(17):2224. doi: 10.3390/plants11172224. Plants (Basel). 2022. PMID: 36079606 Free PMC article. Review.
-
Local adaptation and spatiotemporal patterns of genetic diversity revealed by repeated sampling of Caenorhabditis elegans across the Hawaiian Islands.Mol Ecol. 2022 Apr;31(8):2327-2347. doi: 10.1111/mec.16400. Epub 2022 Feb 25. Mol Ecol. 2022. PMID: 35167162 Free PMC article.
-
Comparing Adaptive Radiations Across Space, Time, and Taxa.J Hered. 2020 Feb 5;111(1):1-20. doi: 10.1093/jhered/esz064. J Hered. 2020. PMID: 31958131 Free PMC article.
-
Phylogenomics of the tetraploid Hawaiian lobeliads: Implications for their origin, dispersal history, and adaptive radiation.Proc Natl Acad Sci U S A. 2025 May 13;122(19):e2421004122. doi: 10.1073/pnas.2421004122. Epub 2025 May 5. Proc Natl Acad Sci U S A. 2025. PMID: 40324077
References
-
- Otte D. The Crickets of Hawaii: Origin, Systematics and Evolution. The Orthopterists' Society; Philadelphia: 1994. p. 338.
-
- Grant P-R, Grant B-R. How and why species multiply. In: Grant P-R, Grant B-R, editors. The Radiation of Darwin’s Finches. Princeton Univ Press; Princeton: 2008.
-
- Rubinoff D, Haines W-P. Web-spinning caterpillar stalks snails. Science. 2005;309(5734):575. - PubMed
Publication types
MeSH terms
LinkOut - more resources
Full Text Sources
Other Literature Sources
