Inferring responses to climate dynamics from historical demography in neotropical forest lizards
- PMID: 27432951
- PMCID: PMC4961184
- DOI: 10.1073/pnas.1601063113
Inferring responses to climate dynamics from historical demography in neotropical forest lizards
Abstract
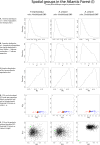
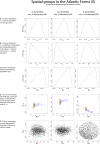
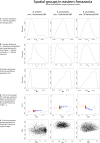
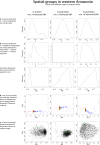
We apply a comparative framework to test for concerted demographic changes in response to climate shifts in the neotropical lowland forests, learning from the past to inform projections of the future. Using reduced genomic (SNP) data from three lizard species codistributed in Amazonia and the Atlantic Forest (Anolis punctatus, Anolis ortonii, and Polychrus marmoratus), we first reconstruct former population history and test for assemblage-level responses to cycles of moisture transport recently implicated in changes of forest distribution during the Late Quaternary. We find support for population shifts within the time frame of inferred precipitation fluctuations (the last 250,000 y) but detect idiosyncratic responses across species and uniformity of within-species responses across forest regions. These results are incongruent with expectations of concerted population expansion in response to increased rainfall and fail to detect out-of-phase demographic syndromes (expansions vs. contractions) across forest regions. Using reduced genomic data to infer species-specific demographical parameters, we then model the plausible spatial distribution of genetic diversity in the Atlantic Forest into future climates (2080) under a medium carbon emission trajectory. The models forecast very distinct trajectories for the lizard species, reflecting unique estimated population densities and dispersal abilities. Ecological and demographic constraints seemingly lead to distinct and asynchronous responses to climatic regimes in the tropics, even among similarly distributed taxa. Incorporating such constraints is key to improve modeling of the distribution of biodiversity in the past and future.
Keywords: Amazon Forest; Atlantic Forest; climate change; phylogeography; population genomics.
Conflict of interest statement
The authors declare no conflict of interest.
Figures


Similar articles
-
A mid-Pleistocene rainforest corridor enabled synchronous invasions of the Atlantic Forest by Amazonian anole lizards.Mol Ecol. 2016 Oct;25(20):5174-5186. doi: 10.1111/mec.13821. Epub 2016 Sep 16. Mol Ecol. 2016. PMID: 27564209
-
Pleistocene climatic changes drive diversification across a tropical savanna.Mol Ecol. 2018 Jan;27(2):520-532. doi: 10.1111/mec.14441. Epub 2017 Dec 21. Mol Ecol. 2018. PMID: 29178445
-
Biogeographic links between southern Atlantic Forest and western South America: Rediscovery, re-description, and phylogenetic relationships of two rare montane anole lizards from Brazil.Mol Phylogenet Evol. 2017 Aug;113:49-58. doi: 10.1016/j.ympev.2017.05.009. Epub 2017 May 11. Mol Phylogenet Evol. 2017. PMID: 28502765
-
Molecular data reveal spatial and temporal patterns of diversification and a cryptic new species of lowland Stenocercus Duméril & Bibron, 1837 (Squamata: Tropiduridae).Mol Phylogenet Evol. 2016 Jan;94(Pt A):410-23. doi: 10.1016/j.ympev.2015.09.010. Epub 2015 Sep 30. Mol Phylogenet Evol. 2016. PMID: 26432394
-
Altered dynamics of forest recovery under a changing climate.Glob Chang Biol. 2013 Jul;19(7):2001-21. doi: 10.1111/gcb.12194. Epub 2013 Apr 3. Glob Chang Biol. 2013. PMID: 23529980 Review.
Cited by
-
Climatic niche breadths of the Atlantic Forest snakes do not increase with increasing latitude.Curr Zool. 2021 Nov 6;68(5):535-540. doi: 10.1093/cz/zoab091. eCollection 2022 Oct. Curr Zool. 2021. PMID: 36324542 Free PMC article.
-
Strategies for improving approximate Bayesian computation tests for synchronous diversification.BMC Evol Biol. 2017 Aug 24;17(1):203. doi: 10.1186/s12862-017-1052-6. BMC Evol Biol. 2017. PMID: 28836959 Free PMC article.
-
Multiple drainage reversal episodes and glacial refugia in a Patagonian fish revealed by sequenced microsatellites.Proc Biol Sci. 2020 Jun 10;287(1928):20200468. doi: 10.1098/rspb.2020.0468. Epub 2020 Jun 3. Proc Biol Sci. 2020. PMID: 32486985 Free PMC article.
-
Successive climate crises in the deep past drove the early evolution and radiation of reptiles.Sci Adv. 2022 Aug 19;8(33):eabq1898. doi: 10.1126/sciadv.abq1898. Epub 2022 Aug 19. Sci Adv. 2022. PMID: 35984885 Free PMC article.
-
In the light of evolution X: Comparative phylogeography.Proc Natl Acad Sci U S A. 2016 Jul 19;113(29):7957-61. doi: 10.1073/pnas.1604338113. Proc Natl Acad Sci U S A. 2016. PMID: 27432955 Free PMC article. No abstract available.
References
-
- Avise JC, et al. Intraspecific phylogeography: The mitochondrial DNA bridge between population genetics and systematics. Annu Rev Ecol Syst. 1987;1987:489–522.
-
- Avise JC. Phylogeography: The History and Formation of Species. Harvard Univ Press; Cambridge, MA: 2000.
-
- Moritz C, Patton JL, Schneider CJ, Smith TB. Diversification of rainforest faunas: An integrated molecular approach. Annu Rev Ecol Evol Syst. 2000;31(1):533–563.
-
- Schneider CJ, Cunningham M, Moritz C. Comparative phylogeography and the history of endemic vertebrates in the Wet Tropics rainforests of Australia. Mol Ecol. 1998;7(4):487–498.
Publication types
MeSH terms
LinkOut - more resources
Full Text Sources
Other Literature Sources
Miscellaneous

