

Comparative phylogeography clarifies the complexity and problems of continental distribution that drove A. R. Wallace to favor islands
- PMID: 27432953
- PMCID: PMC4961131
- DOI: 10.1073/pnas.1601072113
Comparative phylogeography clarifies the complexity and problems of continental distribution that drove A. R. Wallace to favor islands
Abstract
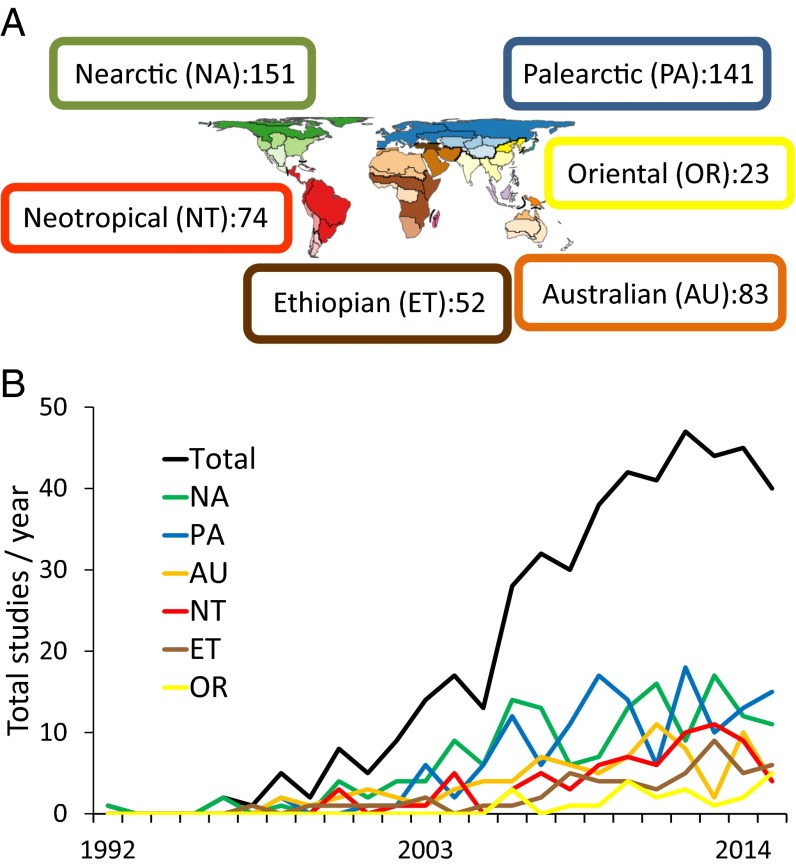
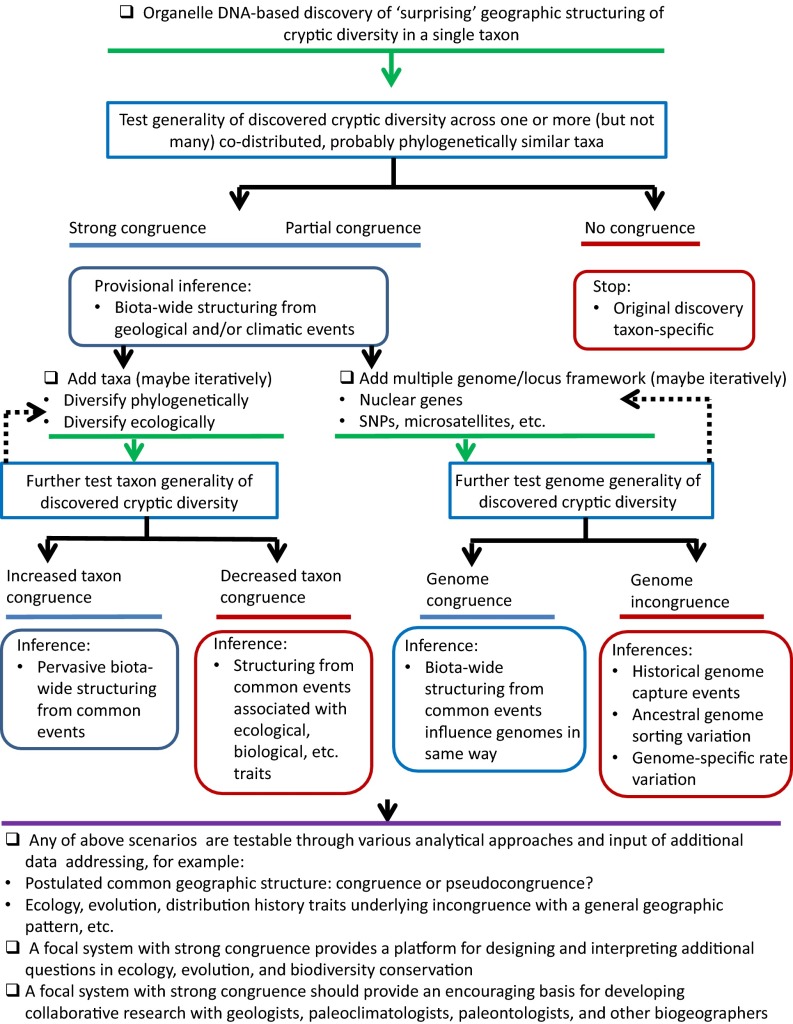
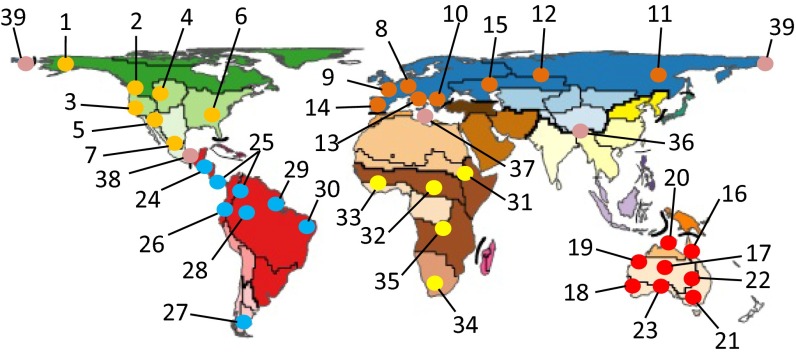
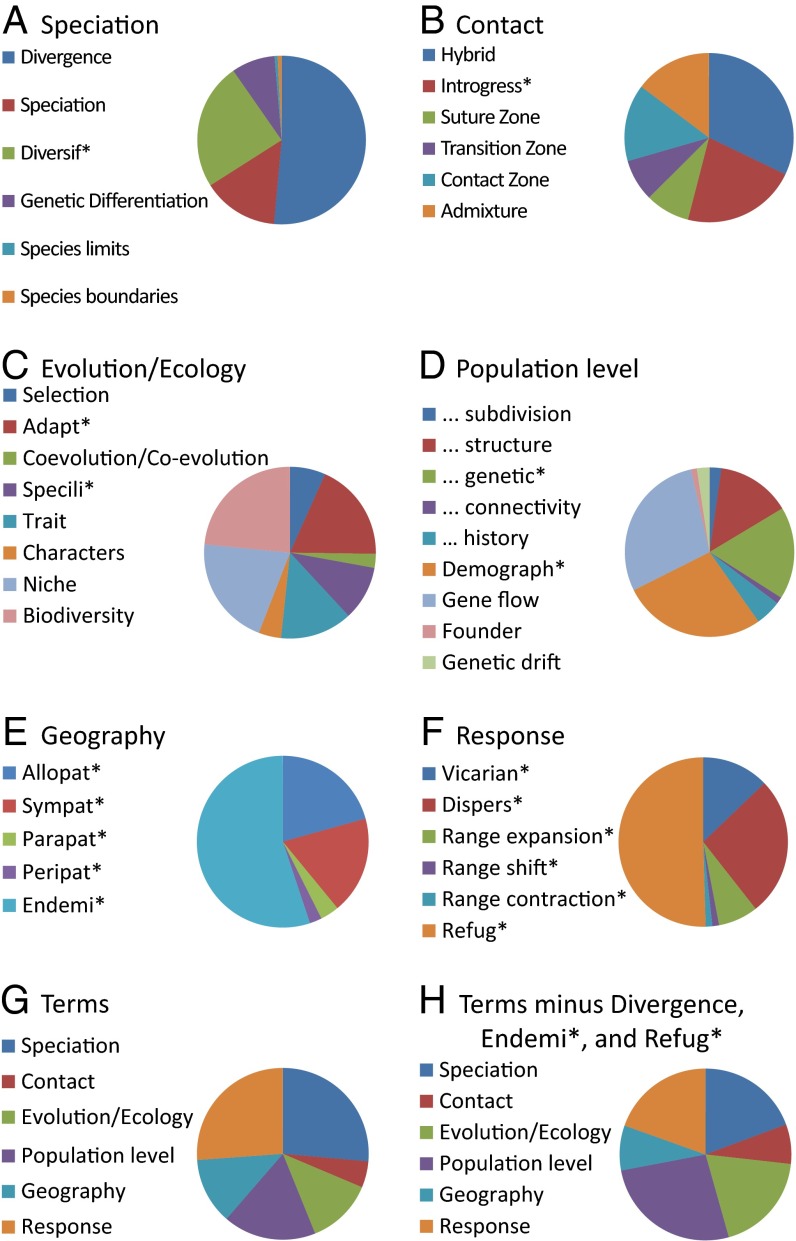
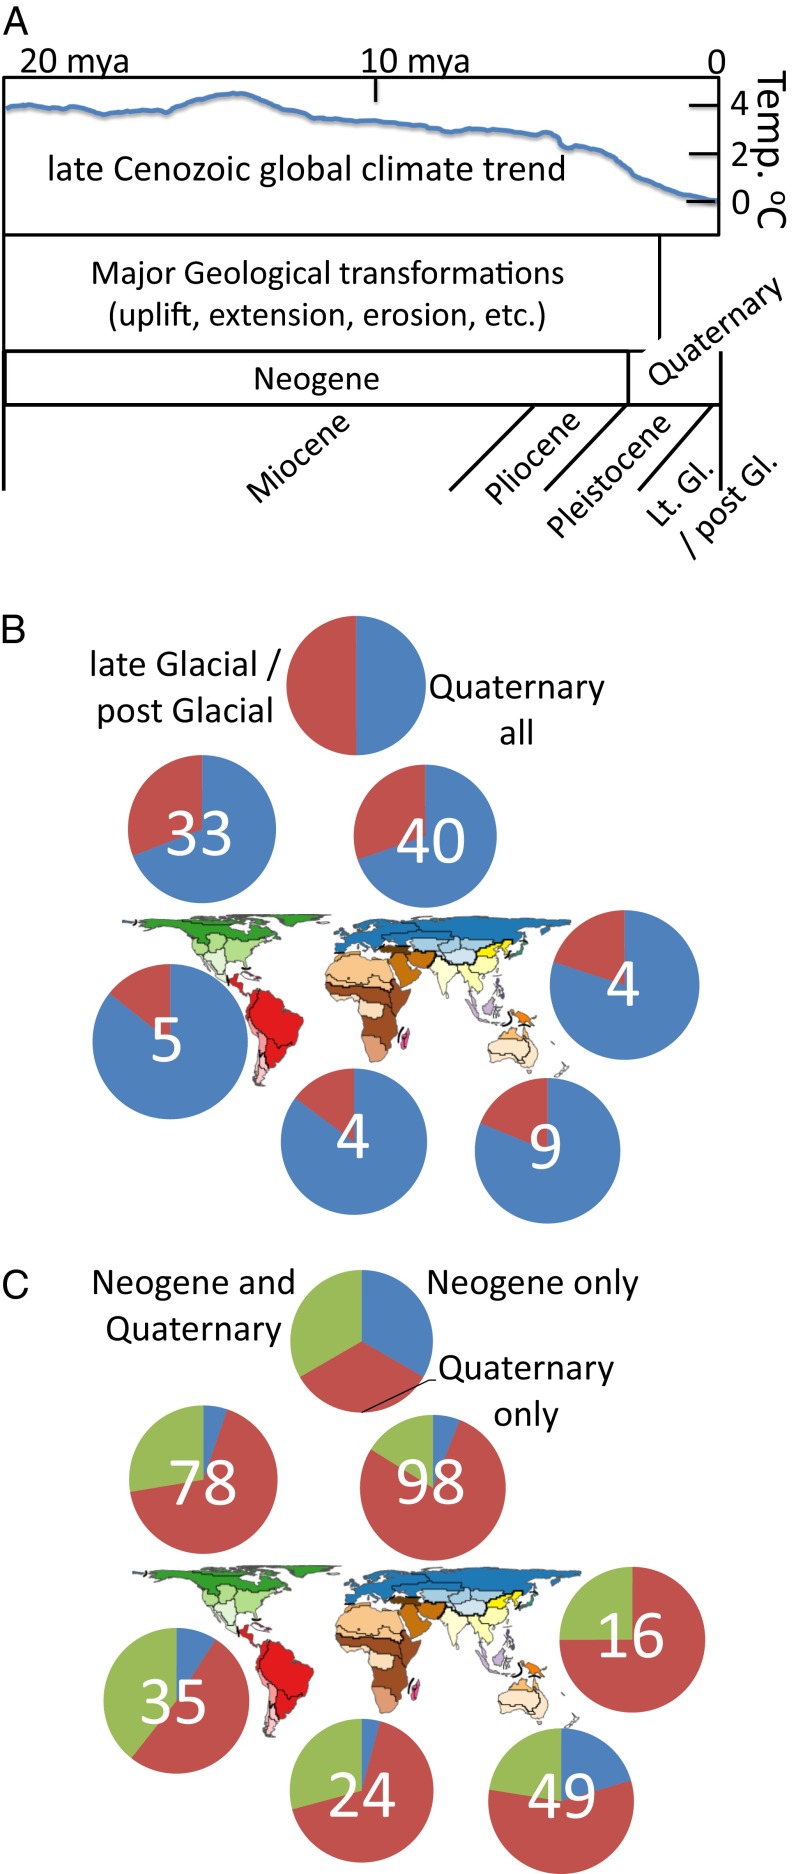
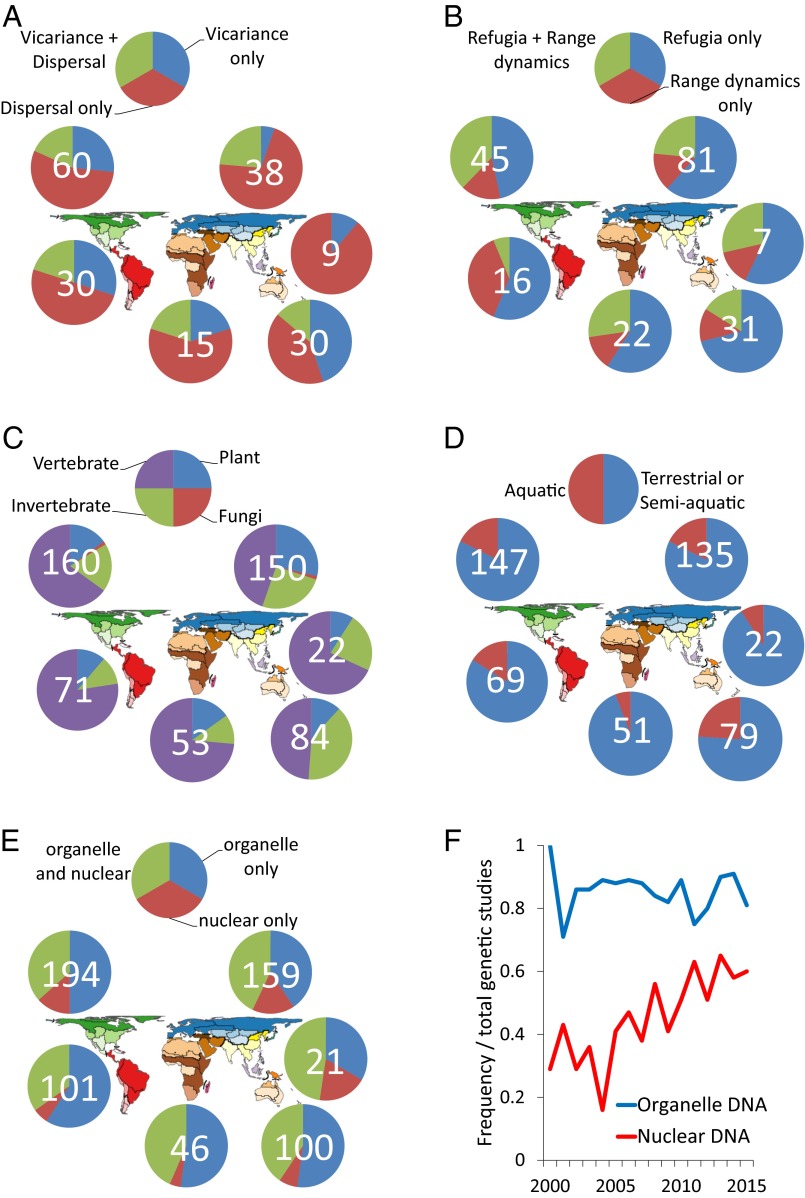
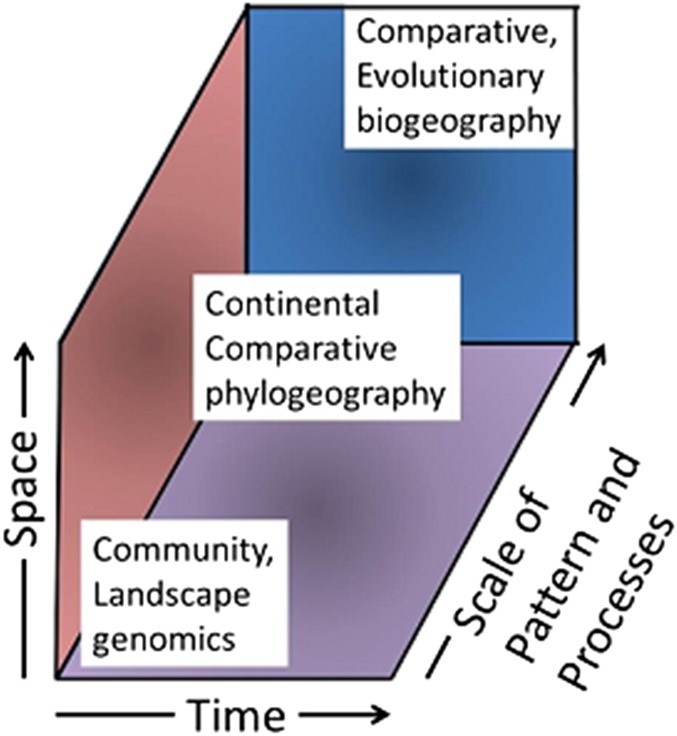
Deciphering the geographic context of diversification and distributional dynamics in continental biotas has long been an interest of biogeographers, ecologists, and evolutionary biologists. Thirty years ago, the approach now known as comparative phylogeography was introduced in a landmark study of a continental biota. Here, I use a set of 455 studies to explore the current scope of continental comparative phylogeography, including geographic, conceptual, temporal, ecological, and genomic attributes. Geographically, studies are more frequent in the northern hemisphere, but the south is catching up. Most studies focus on a Quaternary timeframe, but the Neogene is well represented. As such, explanations for geographic structure and history include geological and climatic events in Earth history, and responses include vicariance, dispersal, and range contraction-expansion into and out of refugia. Focal taxa are biased toward terrestrial or semiterrestrial vertebrates, although plants and invertebrates are well represented in some regions. The use of various kinds of nuclear DNA markers is increasing, as are multiple locus studies, but use of organelle DNA is not decreasing. Species distribution models are not yet widely incorporated into studies. In the future, continental comparative phylogeographers will continue to contribute to erosion of the simple vicariance vs. dispersal paradigm, including exposure of the widespread nature of temporal pseudocongruence and its implications for models of diversification; provide new templates for addressing a variety of ecological and evolutionary traits; and develop closer working relationships with earth scientists and biologists in a variety of disciplines.
Keywords: biodiversity conservation; biogeography; diversification; ecology; evolutionary biology.
Conflict of interest statement
The author declares no conflict of interest.
Figures
Similar articles
-
Phylogeography and biogeography of the lower Central American Neotropics: diversification between two continents and between two seas.Biol Rev Camb Philos Soc. 2014 Nov;89(4):767-90. doi: 10.1111/brv.12076. Epub 2014 Feb 3. Biol Rev Camb Philos Soc. 2014. PMID: 24495219 Review.
-
Multiple quaternary refugia in the eastern Guiana shield revealed by comparative phylogeography of 12 frog species.Syst Biol. 2012 May;61(3):461-89. doi: 10.1093/sysbio/syr130. Epub 2012 Jan 4. Syst Biol. 2012. PMID: 22223446
-
[Hyperbolic growth of marine and continental biodiversity through the phanerozoic and community evolution].Zh Obshch Biol. 2008 May-Jun;69(3):175-94. Zh Obshch Biol. 2008. PMID: 18677962 Russian.
-
Widespread correlations between climatic niche evolution and species diversification in birds.J Anim Ecol. 2016 Jul;85(4):869-78. doi: 10.1111/1365-2656.12530. Epub 2016 May 12. J Anim Ecol. 2016. PMID: 27064436
-
Ecological and evolutionary perspectives on community assembly.Trends Ecol Evol. 2015 May;30(5):241-7. doi: 10.1016/j.tree.2015.02.008. Epub 2015 Mar 21. Trends Ecol Evol. 2015. PMID: 25804867 Review.
Cited by
-
Comparative phylogeography of the ocean planet.Proc Natl Acad Sci U S A. 2016 Jul 19;113(29):7962-9. doi: 10.1073/pnas.1602404113. Proc Natl Acad Sci U S A. 2016. PMID: 27432963 Free PMC article.
-
Cytotype distribution and chloroplast phylogeography of the Actinidia chinensis complex.BMC Plant Biol. 2021 Jul 6;21(1):325. doi: 10.1186/s12870-021-03099-y. BMC Plant Biol. 2021. PMID: 34229602 Free PMC article.
-
Common patterns in the molecular phylogeography of western palearctic birds: a comprehensive review.J Ornithol. 2021;162(4):937-959. doi: 10.1007/s10336-021-01893-x. Epub 2021 May 13. J Ornithol. 2021. PMID: 34007780 Free PMC article. Review.
-
Comparative multi-locus assessment of modern Asian newts ( Cynops, Paramesotriton, and Pachytriton: Salamandridae) in southern China suggests a shared biogeographic history.Zool Res. 2022 Sep 18;43(5):706-718. doi: 10.24272/j.issn.2095-8137.2022.080. Zool Res. 2022. PMID: 35927393 Free PMC article.
-
Opportunities and challenges of macrogenetic studies.Nat Rev Genet. 2021 Dec;22(12):791-807. doi: 10.1038/s41576-021-00394-0. Epub 2021 Aug 18. Nat Rev Genet. 2021. PMID: 34408318 Review.
References
-
- Wallace AR. The Geographical Distribution of Animals. Macmillan; London: 1876.
-
- Morrone JJ. Biogeographical regionalisation of the world: A reappraisal. Aust Syst Bot. 2015;28(2-3):81–90.
-
- Kreft H, Jetz W. A framework for delineating biogeographical regions based on species distributions. J Biogeogr. 2010;37(11):2029–2053.
-
- Wallace AR. On the monkeys of the Amazon. Proc Zool Soc Lond. 1852;20(2):107–110.
MeSH terms
LinkOut - more resources
Full Text Sources
Other Literature Sources
Research Materials
