

Reticulation, divergence, and the phylogeography-phylogenetics continuum
- PMID: 27432956
- PMCID: PMC4961137
- DOI: 10.1073/pnas.1601066113
Reticulation, divergence, and the phylogeography-phylogenetics continuum
Abstract
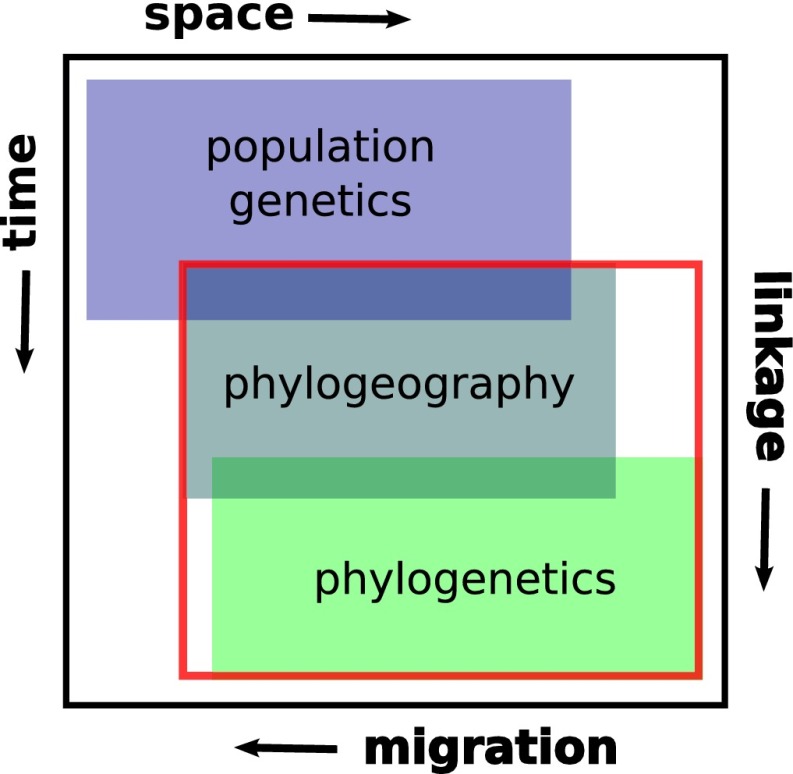
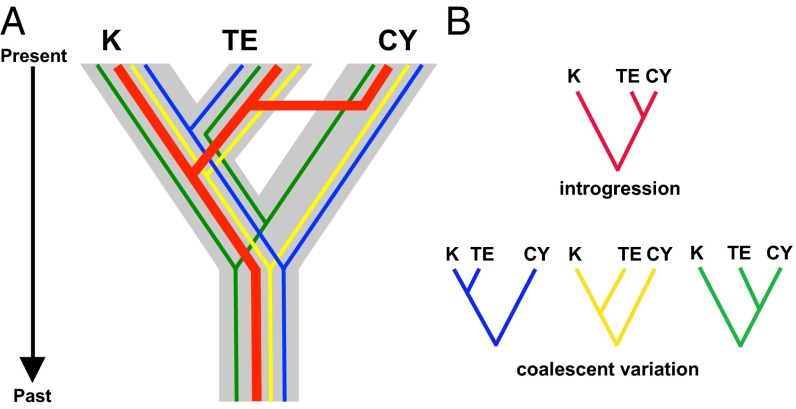
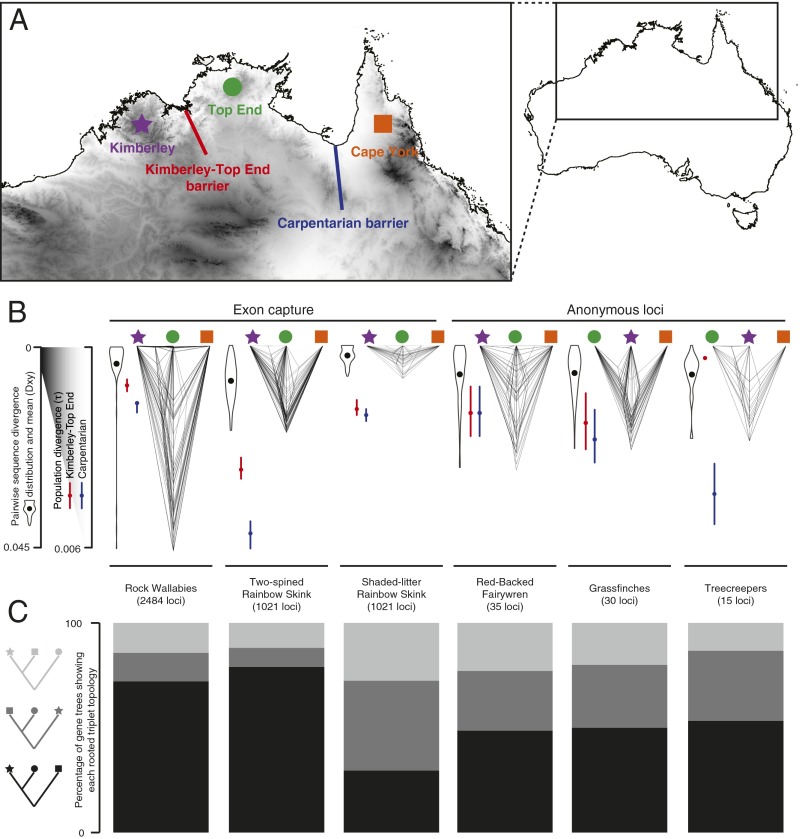
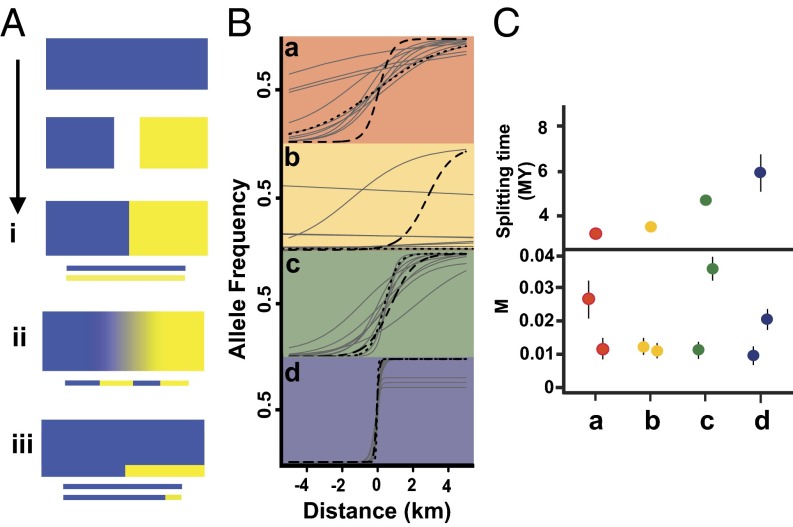
Phylogeography, and its extensions into comparative phylogeography, have their roots in the layering of gene trees across geography, a paradigm that was greatly facilitated by the nonrecombining, fast evolution provided by animal mtDNA. As phylogeography moves into the era of next-generation sequencing, the specter of reticulation at several levels-within loci and genomes in the form of recombination and across populations and species in the form of introgression-has raised its head with a prominence even greater than glimpsed during the nuclear gene PCR era. Here we explore the theme of reticulation in comparative phylogeography, speciation analysis, and phylogenomics, and ask how the centrality of gene trees has fared in the next-generation era. To frame these issues, we first provide a snapshot of multilocus phylogeographic studies across the Carpentarian Barrier, a prominent biogeographic barrier dividing faunas spanning the monsoon tropics in northern Australia. We find that divergence across this barrier is evident in most species, but is heterogeneous in time and demographic history, often reflecting the taxonomic distinctness of lineages spanning it. We then discuss a variety of forces generating reticulate patterns in phylogeography, including introgression, contact zones, and the potential selection-driven outliers on next-generation molecular markers. We emphasize the continued need for demographic models incorporating reticulation at the level of genomes and populations, and conclude that gene trees, whether explicit or implicit, should continue to play a role in the future of phylogeography.
Keywords: coalescent theory; comparative phylogeography; introgression; monsoon tropics; species trees.
Conflict of interest statement
The authors declare no conflict of interest.
Figures
Similar articles
-
Divergence across Australia's Carpentarian barrier: statistical phylogeography of the red-backed fairy wren (Malurus melanocephalus).Evolution. 2008 Dec;62(12):3117-34. doi: 10.1111/j.1558-5646.2008.00543.x. Evolution. 2008. PMID: 19087188
-
Phylogeographic structure across one of the largest intact tropical savannahs: Molecular and morphological analysis of Australia's iconic frilled lizard Chlamydosaurus kingii.Mol Phylogenet Evol. 2017 Jan;106:217-227. doi: 10.1016/j.ympev.2016.09.002. Epub 2016 Sep 21. Mol Phylogenet Evol. 2017. PMID: 27664346
-
Integrating phylogenetics, phylogeography and population genetics through genomes and evolutionary theory.Mol Phylogenet Evol. 2013 Dec;69(3):1172-85. doi: 10.1016/j.ympev.2013.06.006. Epub 2013 Jun 22. Mol Phylogenet Evol. 2013. PMID: 23800835
-
Multilocus phylogeography and phylogenetics using sequence-based markers.Genetica. 2009 Apr;135(3):439-55. doi: 10.1007/s10709-008-9293-3. Epub 2008 Jul 24. Genetica. 2009. PMID: 18651229 Review.
-
Applications of next-generation sequencing to phylogeography and phylogenetics.Mol Phylogenet Evol. 2013 Feb;66(2):526-38. doi: 10.1016/j.ympev.2011.12.007. Epub 2011 Dec 14. Mol Phylogenet Evol. 2013. PMID: 22197804 Review.
Cited by
-
Candidate-species delimitation in Desmognathus salamanders reveals gene flow across lineage boundaries, confounding phylogenetic estimation and clarifying hybrid zones.Ecol Evol. 2022 Feb 16;12(2):e8574. doi: 10.1002/ece3.8574. eCollection 2022 Feb. Ecol Evol. 2022. PMID: 35222955 Free PMC article.
-
Embracing heterogeneity: coalescing the Tree of Life and the future of phylogenomics.PeerJ. 2019 Feb 14;7:e6399. doi: 10.7717/peerj.6399. eCollection 2019. PeerJ. 2019. PMID: 30783571 Free PMC article.
-
Female-biased gene flow between two species of Darwin's finches.Nat Ecol Evol. 2020 Jul;4(7):979-986. doi: 10.1038/s41559-020-1183-9. Epub 2020 May 4. Nat Ecol Evol. 2020. PMID: 32367030
-
Conserved Nonexonic Elements: A Novel Class of Marker for Phylogenomics.Syst Biol. 2017 Nov 1;66(6):1028-1044. doi: 10.1093/sysbio/syx058. Syst Biol. 2017. PMID: 28637293 Free PMC article.
-
Signal, Uncertainty, and Conflict in Phylogenomic Data for a Diverse Lineage of Microbial Eukaryotes (Diatoms, Bacillariophyta).Mol Biol Evol. 2018 Jan 1;35(1):80-93. doi: 10.1093/molbev/msx268. Mol Biol Evol. 2018. PMID: 29040712 Free PMC article.
References
-
- Avise JC, et al. Intraspecific phylogeography: The mitochondrial DNA bridge between population genetics and systematics. Annu Rev Ecol Syst. 1987;18:489–522.
-
- Moritz C, Dowling TE, Brown WM. Evolution of animal mitochondrial-DNA–relevance for population biology and systematics. Annu Rev Ecol Syst. 1987;18:269–292.
-
- Dolman G, Moritz C. A multilocus perspective on refugial isolation and divergence in rainforest skinks (Carlia) Evolution. 2006;60(3):573–582. - PubMed
Publication types
MeSH terms
Grants and funding
LinkOut - more resources
Full Text Sources
Other Literature Sources
Research Materials
