. 2016 Aug 2;113(31):E4531-40.
doi: 10.1073/pnas.1524685113. Epub 2016 Jul 18.

Hierarchical decision processes that operate over distinct timescales underlie choice and changes in strategy

Affiliations

Hierarchical decision processes that operate over distinct timescales underlie choice and changes in strategy

Braden A Purcell et al. Proc Natl Acad Sci U S A. .

Abstract

Decision-making in a natural environment depends on a hierarchy of interacting decision processes. A high-level strategy guides ongoing choices, and the outcomes of those choices determine whether or not the strategy should change. When the right decision strategy is uncertain, as in most natural settings, feedback becomes ambiguous because negative outcomes may be due to limited information or bad strategy. Disambiguating the cause of feedback requires active inference and is key to updating the strategy. We hypothesize that the expected accuracy of a choice plays a crucial rule in this inference, and setting the strategy depends on integration of outcome and expectations across choices. We test this hypothesis with a task in which subjects report the net direction of random dot kinematograms with varying difficulty while the correct stimulus-response association undergoes invisible and unpredictable switches every few trials. We show that subjects treat negative feedback as evidence for a switch but weigh it with their expected accuracy. Subjects accumulate switch evidence (in units of log-likelihood ratio) across trials and update their response strategy when accumulated evidence reaches a bound. A computational framework based on these principles quantitatively explains all aspects of the behavior, providing a plausible neural mechanism for the implementation of hierarchical multiscale decision processes. We suggest that a similar neural computation-bounded accumulation of evidence-underlies both the choice and switches in the strategy that govern the choice, and that expected accuracy of a choice represents a key link between the levels of the decision-making hierarchy.

Keywords: adaptive behavior; confidence; executive control; hierarchical decision-making; perceptual decision-making.


Conflict of interest statement

The authors declare no conflict of interest.

Figures

Fig. 1.
Fig. 1.
Changing environment task. (A) Task design. The pairs of targets above and below the FP represented two environments. The right and left targets in each environment represented the two possible directions of motion. Subjects received positive feedback for choosing the target that corresponded to both the correct environment and correct motion direction. The motion direction, motion strength (percentage of coherently moving dots, %Coh), and duration varied randomly from trial to trial. The rewarding environment stayed fixed for a variable number of trials (2−15, truncated geometric distribution) and then changed without explicit cue. Subjects had to discover the correct environment based on the history of feedback, choice, and choice certainty. (B) Example sequence of trials from one experimental session. On each trial, the subject chose a target in the upper (EU) or lower (EL) environment (circles). They received positive feedback (filled circles) if the chosen target matched both the correct environment (black line) and motion direction, and negative feedback (open circles) if either was incorrect.
Fig. 2.
Fig. 2.
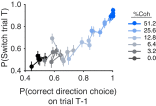
The motion stimulus of the current trial informed direction choices, and feedback and expected accuracy of previous trials informed environment choices. (A) Motion direction discrimination accuracy increased with motion strength. Data points show the accuracy of direction choices disregarding environment choices. (B) The proportion of environment switches increased following negative feedback on trials with stronger motion (colored points) and was consistently low following positive feedback (black points). The circles in both panels are data, and the lines show model fits. Data and model fits in both panels are pooled across subjects (see Fig. S1 for individual subjects, and see Table S1 for parameter values). Error bars are SE.
Fig. S1.
Fig. S1.
(A) Direction and (B) environment choices for individual subjects (S1−S6). Conventions are similar to Fig. 2. In both panels, circles are data, and lines are model fits. All subjects were more likely to switch environment choices following negative feedback on trials with stronger motion. Error bars are SE.
Fig. S2.
Fig. S2.
Motion strength and duration influence both motion direction choices and environment choices. (A) The accuracy of motion direction choices increased with motion strength and duration on the current trial. Data points show the accuracy of direction choices disregarding environment choices. Stimulus viewing durations were divided into quintiles. The lines show model fits in both panels. Data and fits are pooled across subjects. (B) Environment switches were more likely following negative feedback on trials with stronger motion and longer stimulus durations. Error bars are SE.
Fig. S3.
Fig. S3.
Expected accuracy is the key variable determining switching. The probability of switching after negative feedback is plotted as a function of direction choice accuracy on the preceding trial for each motion strength (%Coh) and duration quintile. If different motion strengths and durations are associated with similar expected accuracies, they predict a similar probability of switch following a negative feedback.
Fig. 3.
Fig. 3.
Environment choices were shaped by integration of feedback and expected motion direction accuracy across multiple trials. (A) Consecutive negative feedbacks increased the probability of switching environment choices. In all panels, lines show model fits and circles show data points pooled across subjects. (B) The probability of switching increased with motion strength on the previous trial. Different shades of gray show the number of preceding consecutive errors. (C) Subjects recognized environment changes faster when they received negative feedback with higher expected direction choice accuracy. Data points show the proportion of correct environment choices as a function of the number of trials relative to an uncued environment change. Trials are divided by motion strength (%Coh) on the change trial (trial = 0). Error bars are SE. See Fig. S4 for data and fits from individual subjects.
Fig. S4.
Fig. S4.
Environment choices of all subjects were informed by integration of feedback and expected motion direction accuracy across multiple trials. Conventions are similar to Fig. 3. (A) Probability of switching environment choices following different numbers of consecutive feedbacks. (B) Probability of switching as a function of motion strength on the previous trial following one, two, or three consecutive negative feedbacks. (C) Proportion of correct environment choices as a function of the number of trials relative to an uncued environment change. Color indicates motion strength on the trial in which change occurred (trial = 0; see key). In all panels, circles are data, and lines are model fits. Error bars are SE.
Fig. 4.
Fig. 4.
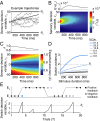
The Uncertainty Accumulation model. (A) Direction choices result from accumulation of sensory evidence within trials (gray lines are example single trial trajectories, and black line shows mean accumulation rate, μd = kC). A direction choice is made when accumulated evidence (sensory decision variable, vd) reaches a bound (±Bd) or by the sign of vd when the motion stimulus ends. (B) (Lower) The probability density of vd for a rightward motion strength (6.4% coherence). (Upper) The probability of reaching the upper (rightward) bound, P(+Bd), over time. (C) (Lower) Expected direction choice accuracy, A, for different vd and decision time given the decision rule and stimulus set. (Upper) Expected accuracy as a function of decision time when the positive bound is crossed. (D) Switch evidence of a negative feedback [log[1/(1-Â)]; Materials and Methods] for different motion strength and duration. Switch evidence grows with motion strength and stimulus duration due to gradual drift of vd away from 0. The dashed line indicates a fixed switch bound, Be. (E) Example trial sequence and how accumulated switch evidence (switch decision variable, ve) drives switches in environment choice. (Upper) The sequence of environments (lines) and subject’s choices (circles) resulting in positive (filled) or negative (open) feedback. Color indicates motion strength. (Lower) Changes in ve across trials. Subjects switch when ve exceeds the switch bound. For simplicity, we illustrate a fixed Be (but see text for switch urgency).
Fig. 5.
Fig. 5.
Switch evidence reflects across-trial urgency and resets after positive feedback. (A) The proportion of environment switches after negative feedback increased as a function of the number of trials since the last correct switch. In all panels, circles are data and lines are model fits. (B) The probability of switching after negative feedback increased with motion strength and the number of trials in the current environment. (C) Mean switch bound resulting from the best-fitting probability weighting functions (Inset) relating the experienced hazard rate, H(T), to subjective hazard rate, Ĥ(T) (Materials and Methods). Color indicates different subjects. (D) The probability of switching increased with consecutive errors, but dropped to almost 0 after just one positive feedback (trial 0). Switch probabilities before the positive feedback were calculated for an increasing number of consecutive errors within each sequence. Error bars are SE.
Fig. S5.
Fig. S5.
Increased switch bound explains reduced switch rates for longer environments. Shown are data and model fits from five subjects who performed the task with longer and less volatile environments (blue; environment length, 3–20 trials, mean = 10 trials) compared with the original experiment with shorter environments (red; environment length, 2–15 trials, mean = 6 trials). (A) Subjects switched less frequently following negative feedback when environments were longer. Switching still depended on motion strength and feedback on previous trials, but switch rates were lower for all motion strengths. Lines are model fits. The red data points and line are identical to the colored circles and dashed line in Fig. 2B. (B) Subjects were less likely to switch following runs of consecutive negative feedback when environments were longer. Lines are model fits. The red line and data points are identical to Fig. 3A. (C) When the environments were longer, switching after errors was less frequent and increased more gradually with number of trials spent in an environment. The red data points and line are identical to Fig. 5A. (D) Subjects used larger switch bounds for longer environments. The lines show the average collapsing switch bounds for the five new subjects who experienced longer environment durations (blue) and the six subjects who experienced shorter environment durations (red).
Fig. S6.
Fig. S6.
Subjective confidence informs environment choices. (A) Six subjects performed a modified changing environment task with simultaneous report of motion direction confidence. The task structure is identical to our main experiment except that the targets are replaced with elongated bars (length 7°). Subjects varied the end point of their eye movements along the length of the bar to indicate motion direction choice confidence (green, minimal confidence; red, maximal confidence) (4). (B) Subjects were more likely to switch environment choices following negative feedback on trials in which they reported higher subjective confidence. Data points show the mean proportion of environment switches as a function of the saccade end point along the length of each target. Saccade end points are divided into six quantiles. (C) Subjects were more likely to switch environment choices when subjective confidence was higher for the same motion strength and duration. Probability of switching is plotted as a function of residual variations of saccade end points after subtracting the mean of end points for the motion strength and duration (SI Text). Error bars are SE.
Fig. S7.
Fig. S7.
Comparison of observed switching behavior to ideal switching performance. Conventions are similar to Figs. 2 and 3. We fit the motion direction choices using the sensitivity (k) and decision bound (Bd) on the sensory decision variable. Then, we predicted ideal switch performance based on the optimal form of switch evidence and switch bound given the expected accuracy from the sensory decision process and the experienced hazard rate (Materials and Methods). No probability weighting function was applied, and switch noise was excluded. We focused on error sequences that began when the hazard rate was larger than zero (trial three onward). (A) Accumulation of sensory evidence to a decision bound explains the proportion of correct motion direction choices. (B) The proportion of switches increases after negative feedback for choices associated with greater expected accuracy for both model predictions and subjects, but subjects’ overall switch rates are lower. (C) The switch rate increases with consecutive negative feedbacks for both model predictions and subjects, but subjects’ switch rates increase at a slower rate. (D) On the first trial after an environment change, the probability of switching to the correct environment depends on motion strength on the change trial (trial 0) for both model predictions and subjects. However, again, subjects perseverated in the old environment longer than predicted by the optimal model.

References

    1. Logan GD, Gordon RD. Executive control of visual attention in dual-task situations. Psychol Rev. 2001;108(2):393–434. - PubMed
    1. Botvinick MM, Niv Y, Barto AC. Hierarchically organized behavior and its neural foundations: A reinforcement learning perspective. Cognition. 2009;113(3):262–280. - PMC - PubMed
    1. Kiani R, Shadlen MN. Representation of confidence associated with a decision by neurons in the parietal cortex. Science. 2009;324(5928):759–764. - PMC - PubMed
    1. Kiani R, Corthell L, Shadlen MN. Choice certainty is informed by both evidence and decision time. Neuron. 2014;84(6):1329–1342. - PMC - PubMed
    1. Middlebrooks PG, Sommer MA. Neuronal correlates of metacognition in primate frontal cortex. Neuron. 2012;75(3):517–530. - PMC - PubMed

Publication types

LinkOut - more resources