

Human high intelligence is involved in spectral redshift of biophotonic activities in the brain
- PMID: 27432962
- PMCID: PMC4978290
- DOI: 10.1073/pnas.1604855113
Human high intelligence is involved in spectral redshift of biophotonic activities in the brain
Abstract
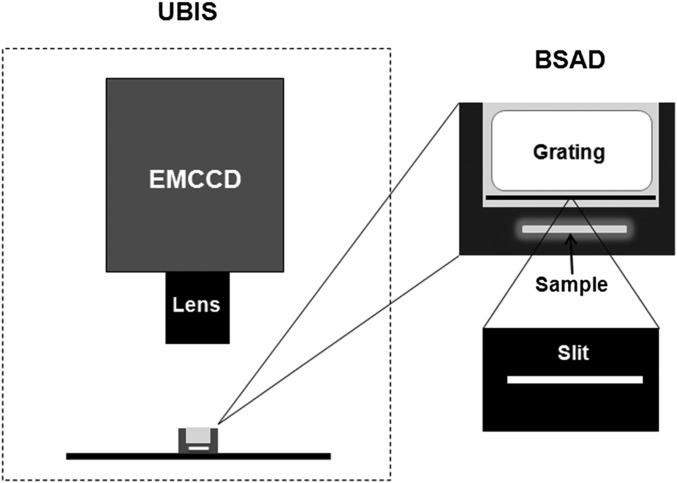
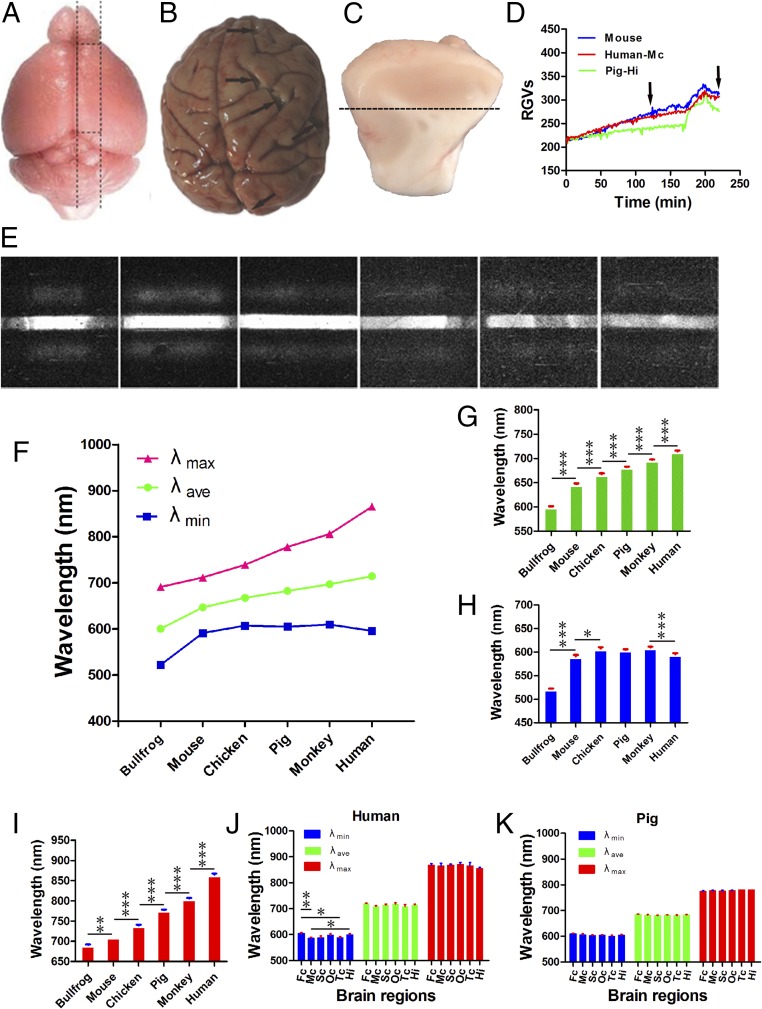
Human beings hold higher intelligence than other animals on Earth; however, it is still unclear which brain properties might explain the underlying mechanisms. The brain is a major energy-consuming organ compared with other organs. Neural signal communications and information processing in neural circuits play an important role in the realization of various neural functions, whereas improvement in cognitive function is driven by the need for more effective communication that requires less energy. Combining the ultraweak biophoton imaging system (UBIS) with the biophoton spectral analysis device (BSAD), we found that glutamate-induced biophotonic activities and transmission in the brain, which has recently been demonstrated as a novel neural signal communication mechanism, present a spectral redshift from animals (in order of bullfrog, mouse, chicken, pig, and monkey) to humans, even up to a near-infrared wavelength (∼865 nm) in the human brain. This brain property may be a key biophysical basis for explaining high intelligence in humans because biophoton spectral redshift could be a more economical and effective measure of biophotonic signal communications and information processing in the human brain.
Keywords: biophoton imaging; brain slices; glutamate; intelligence; ultraweak photon emissions.
Conflict of interest statement
The authors declare no conflict of interest.
Figures
Comment in
-
Relationship between intelligence and spectral characteristics of brain biophoton emission: Correlation does not automatically imply causation.Proc Natl Acad Sci U S A. 2016 Sep 20;113(38):E5540-1. doi: 10.1073/pnas.1612646113. Epub 2016 Sep 12. Proc Natl Acad Sci U S A. 2016. PMID: 27621479 Free PMC article. No abstract available.
Similar articles
-
Spectral blueshift of biophotonic activity and transmission in the ageing mouse brain.Brain Res. 2020 Dec 15;1749:147133. doi: 10.1016/j.brainres.2020.147133. Epub 2020 Sep 21. Brain Res. 2020. PMID: 32971084
-
Spatiotemporal imaging of glutamate-induced biophotonic activities and transmission in neural circuits.PLoS One. 2014 Jan 15;9(1):e85643. doi: 10.1371/journal.pone.0085643. eCollection 2014. PLoS One. 2014. PMID: 24454909 Free PMC article.
-
Biophoton signal transmission and processing in the brain.J Photochem Photobiol B. 2014 Oct 5;139:71-5. doi: 10.1016/j.jphotobiol.2013.12.008. Epub 2013 Dec 25. J Photochem Photobiol B. 2014. PMID: 24461927 Review.
-
Reduced biophotonic activities and spectral blueshift in Alzheimer's disease and vascular dementia models with cognitive impairment.Front Aging Neurosci. 2023 Sep 1;15:1208274. doi: 10.3389/fnagi.2023.1208274. eCollection 2023. Front Aging Neurosci. 2023. PMID: 37727319 Free PMC article.
-
[Evolution of human brain and intelligence].Ideggyogy Sz. 2008 Jul 30;61(7-8):220-9. Ideggyogy Sz. 2008. PMID: 18763477 Review. Hungarian.
Cited by
-
Node of Ranvier as an Array of Bio-Nanoantennas for Infrared Communication in Nerve Tissue.Sci Rep. 2018 Jan 11;8(1):539. doi: 10.1038/s41598-017-18866-x. Sci Rep. 2018. PMID: 29323217 Free PMC article.
-
Are Brain-Computer Interfaces Feasible With Integrated Photonic Chips?Front Neurosci. 2022 Jan 7;15:780344. doi: 10.3389/fnins.2021.780344. eCollection 2021. Front Neurosci. 2022. PMID: 35069099 Free PMC article.
-
Relationship between intelligence and spectral characteristics of brain biophoton emission: Correlation does not automatically imply causation.Proc Natl Acad Sci U S A. 2016 Sep 20;113(38):E5540-1. doi: 10.1073/pnas.1612646113. Epub 2016 Sep 12. Proc Natl Acad Sci U S A. 2016. PMID: 27621479 Free PMC article. No abstract available.
-
Optical van-der-Waals forces in molecules: from electronic Bethe-Salpeter calculations to the many-body dispersion model.Nat Commun. 2022 Feb 10;13(1):813. doi: 10.1038/s41467-022-28461-y. Nat Commun. 2022. PMID: 35145091 Free PMC article.
-
Mechanotransduction, cellular biophotonic activity, and signaling patterns for tissue regeneration.J Biol Chem. 2024 Nov;300(11):107847. doi: 10.1016/j.jbc.2024.107847. Epub 2024 Sep 30. J Biol Chem. 2024. PMID: 39357824 Free PMC article. Review.
References
-
- Roth G, Dicke U. Evolution of the brain and intelligence. Trends Cogn Sci. 2005;9(5):250–257. - PubMed
-
- Jerison HJ. Animal intelligence as encephalization. Philos Trans R Soc Lond B Biol Sci. 1985;308(1135):21–35. - PubMed
-
- Byrne R. The Thinking Ape: Evolutionary Origins of Intelligence. Oxford Univ Press; New York: 1995.
-
- Gibson KR. Evolution of human intelligence: The roles of brain size and mental construction. Brain Behav Evol. 2002;59(1-2):10–20. - PubMed
-
- Bouchard TJ., Jr Genes, evolution and intelligence. Behav Genet. 2014;44(6):549–577. - PubMed
Publication types
MeSH terms
Substances
LinkOut - more resources
Full Text Sources
Other Literature Sources
