

Comparative phylogeography of the ocean planet
- PMID: 27432963
- PMCID: PMC4961182
- DOI: 10.1073/pnas.1602404113
Comparative phylogeography of the ocean planet
Abstract
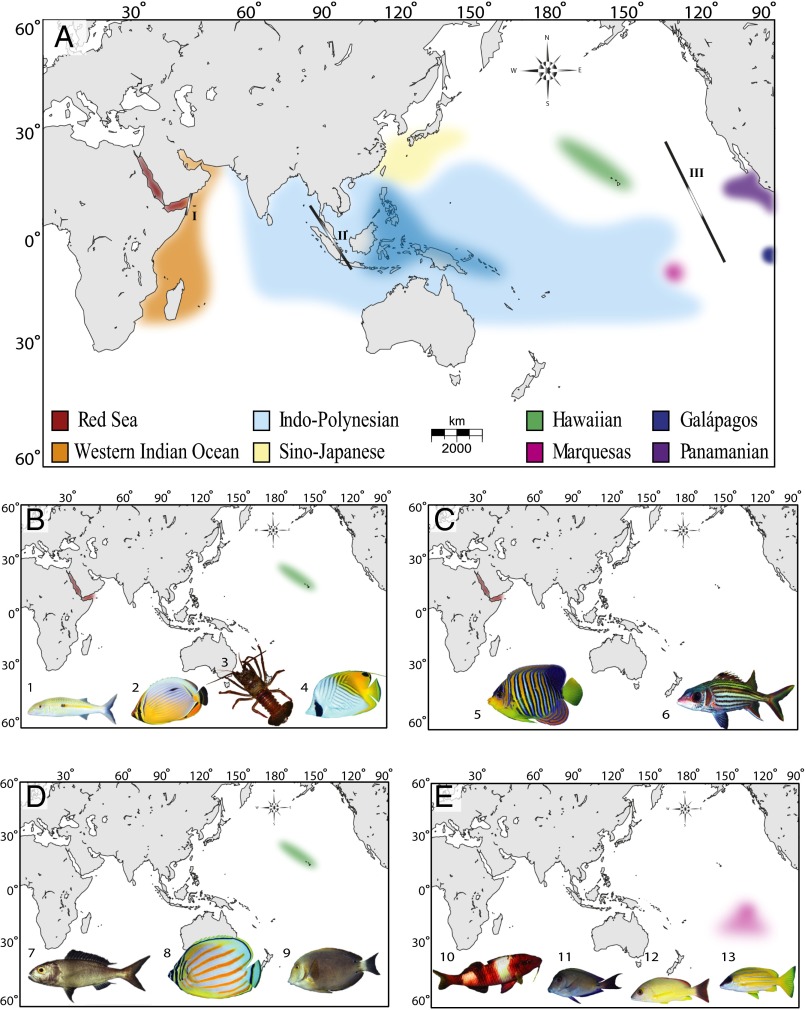
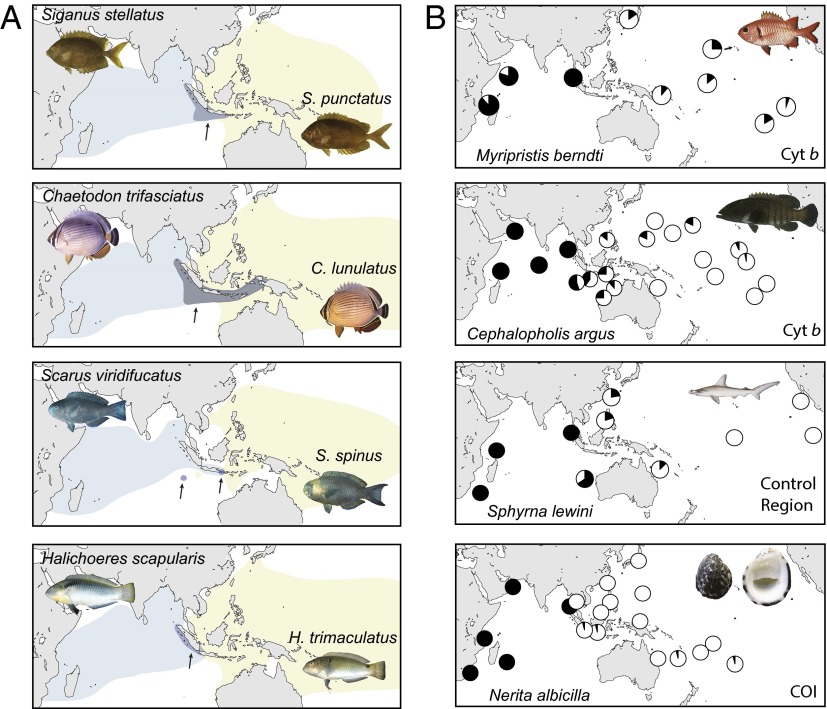
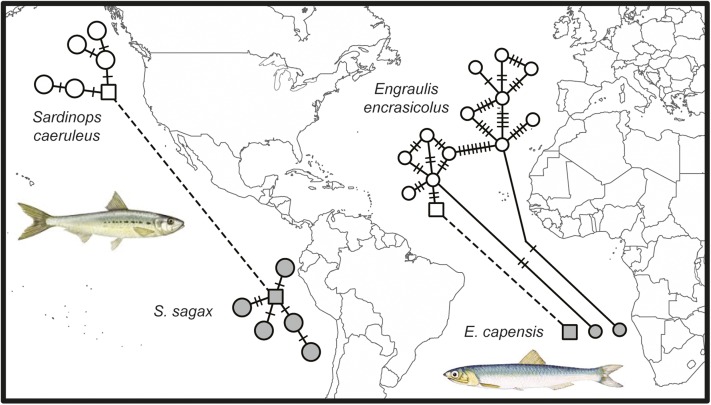
Understanding how geography, oceanography, and climate have ultimately shaped marine biodiversity requires aligning the distributions of genetic diversity across multiple taxa. Here, we examine phylogeographic partitions in the sea against a backdrop of biogeographic provinces defined by taxonomy, endemism, and species composition. The taxonomic identities used to define biogeographic provinces are routinely accompanied by diagnostic genetic differences between sister species, indicating interspecific concordance between biogeography and phylogeography. In cases where individual species are distributed across two or more biogeographic provinces, shifts in genotype frequencies often align with biogeographic boundaries, providing intraspecific concordance between biogeography and phylogeography. Here, we provide examples of comparative phylogeography from (i) tropical seas that host the highest marine biodiversity, (ii) temperate seas with high productivity but volatile coastlines, (iii) migratory marine fauna, and (iv) plankton that are the most abundant eukaryotes on earth. Tropical and temperate zones both show impacts of glacial cycles, the former primarily through changing sea levels, and the latter through coastal habitat disruption. The general concordance between biogeography and phylogeography indicates that the population-level genetic divergences observed between provinces are a starting point for macroevolutionary divergences between species. However, isolation between provinces does not account for all marine biodiversity; the remainder arises through alternative pathways, such as ecological speciation and parapatric (semiisolated) divergences within provinces and biodiversity hotspots.
Keywords: biogeography; coral reefs; evolution; marine biodiversity; speciation.
Conflict of interest statement
The authors declare no conflict of interest.
Figures
Similar articles
-
Biogeography and speciation of terrestrial fauna in the south-western Australian biodiversity hotspot.Biol Rev Camb Philos Soc. 2015 Aug;90(3):762-93. doi: 10.1111/brv.12132. Epub 2014 Aug 15. Biol Rev Camb Philos Soc. 2015. PMID: 25125282 Review.
-
The biogeography of tropical reef fishes: endemism and provinciality through time.Biol Rev Camb Philos Soc. 2017 Nov;92(4):2112-2130. doi: 10.1111/brv.12323. Epub 2017 Feb 23. Biol Rev Camb Philos Soc. 2017. PMID: 28231621 Review.
-
Marine biogeographic realms and species endemicity.Nat Commun. 2017 Oct 20;8(1):1057. doi: 10.1038/s41467-017-01121-2. Nat Commun. 2017. PMID: 29051522 Free PMC article.
-
INTRASPECIFIC PHYLOGEOGRAPHY ACROSS THE POINT CONCEPTION BIOGEOGRAPHIC BOUNDARY.Evolution. 1998 Jun;52(3):734-745. doi: 10.1111/j.1558-5646.1998.tb03698.x. Evolution. 1998. PMID: 28565261
-
Status of marine biodiversity of the China seas.PLoS One. 2013;8(1):e50719. doi: 10.1371/journal.pone.0050719. Epub 2013 Jan 8. PLoS One. 2013. PMID: 23320065 Free PMC article.
Cited by
-
In the light of evolution X: Comparative phylogeography.Proc Natl Acad Sci U S A. 2016 Jul 19;113(29):7957-61. doi: 10.1073/pnas.1604338113. Proc Natl Acad Sci U S A. 2016. PMID: 27432955 Free PMC article. No abstract available.
-
The little shrimp that could: phylogeography of the circumtropical Stenopus hispidus (Crustacea: Decapoda), reveals divergent Atlantic and Pacific lineages.PeerJ. 2018 Mar 6;6:e4409. doi: 10.7717/peerj.4409. eCollection 2018. PeerJ. 2018. PMID: 29527409 Free PMC article.
-
Mechanisms of peripheral phylogeographic divergence in the indo-Pacific: lessons from the spiny lobster Panulirus homarus.BMC Evol Biol. 2017 Aug 18;17(1):195. doi: 10.1186/s12862-017-1050-8. BMC Evol Biol. 2017. PMID: 28821229 Free PMC article.
-
Relationship of stranded cetaceans in Thai territorial waters to global populations: Mitochondrial DNA diversity of Cuvier's beaked whale, Indo Pacific finless porpoise, pygmy sperm whale, and dwarf sperm whale.Sci Prog. 2022 Apr-Jun;105(2):368504221103776. doi: 10.1177/00368504221103776. Sci Prog. 2022. PMID: 35635263 Free PMC article.
-
Divergent Population Structure in Five Common Rockfish Species of Puget Sound, WA Suggests the Need for Species-Specific Management.Mol Ecol. 2025 Jan;34(1):e17590. doi: 10.1111/mec.17590. Epub 2024 Nov 25. Mol Ecol. 2025. PMID: 39587854 Free PMC article.
References
-
- Dana JD. On the isothermal cceanic chart: Illustrating the geographical distribution of marine animals. Am J Sci. 1853;16:314–327.
-
- Woodward SP. A Manual of the Mollusca; or, Rudimentary Treatise of Recent and Fossil Shells. John Weale; London: 1851.
-
- Forbes E. The Natural History of the European Seas. John Van Voorst; London: 1859.
-
- Darwin C, Wallace A. On the tendency of species to form varieties; and on the perpetuation of varieties and species by natural means of selection. Proc Linn Soc London. 1858;3(9):45–62.
MeSH terms
LinkOut - more resources
Full Text Sources
Other Literature Sources
