. 2016 Aug 2;113(31):E4548-57.
doi: 10.1073/pnas.1606383113. Epub 2016 Jul 18.

Superpriming of synaptic vesicles as a common basis for intersynapse variability and modulation of synaptic strength

Affiliations

Superpriming of synaptic vesicles as a common basis for intersynapse variability and modulation of synaptic strength

Holger Taschenberger et al. Proc Natl Acad Sci U S A. .

Abstract

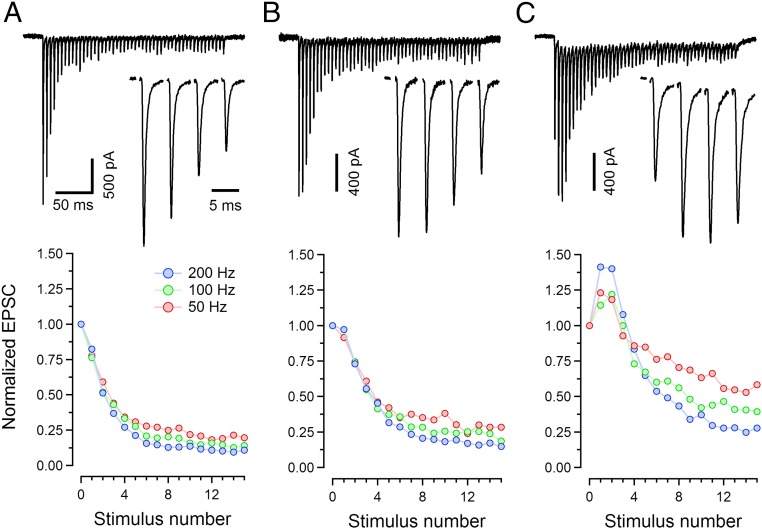
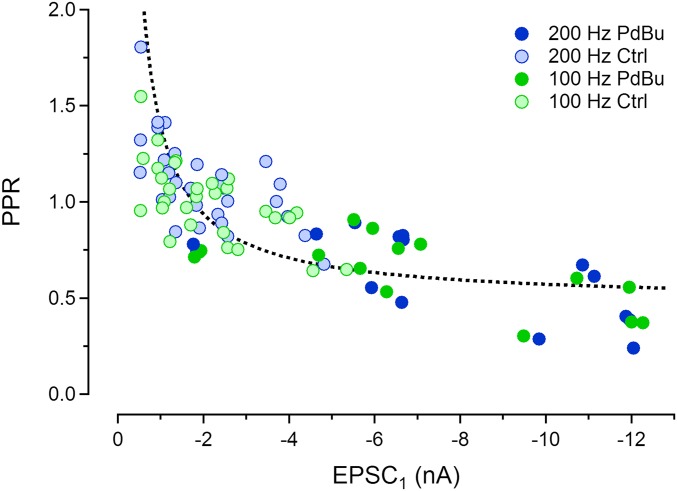
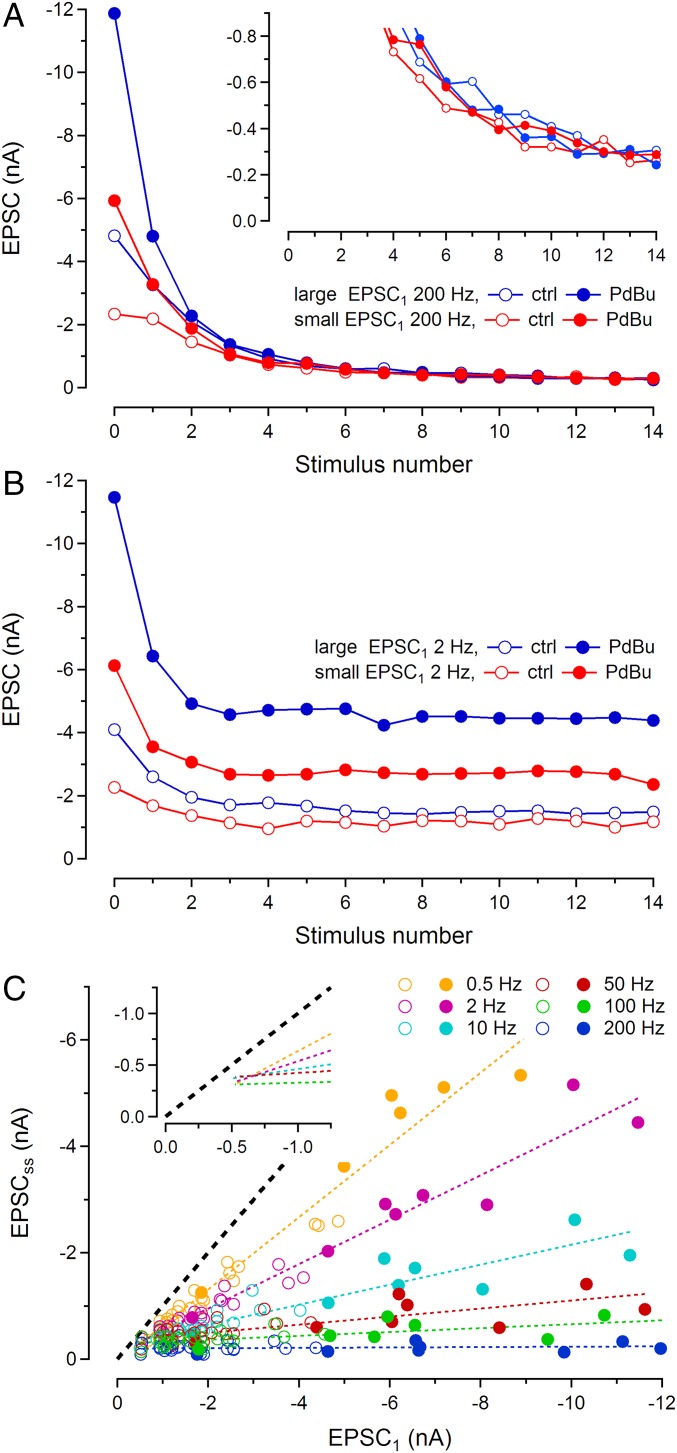
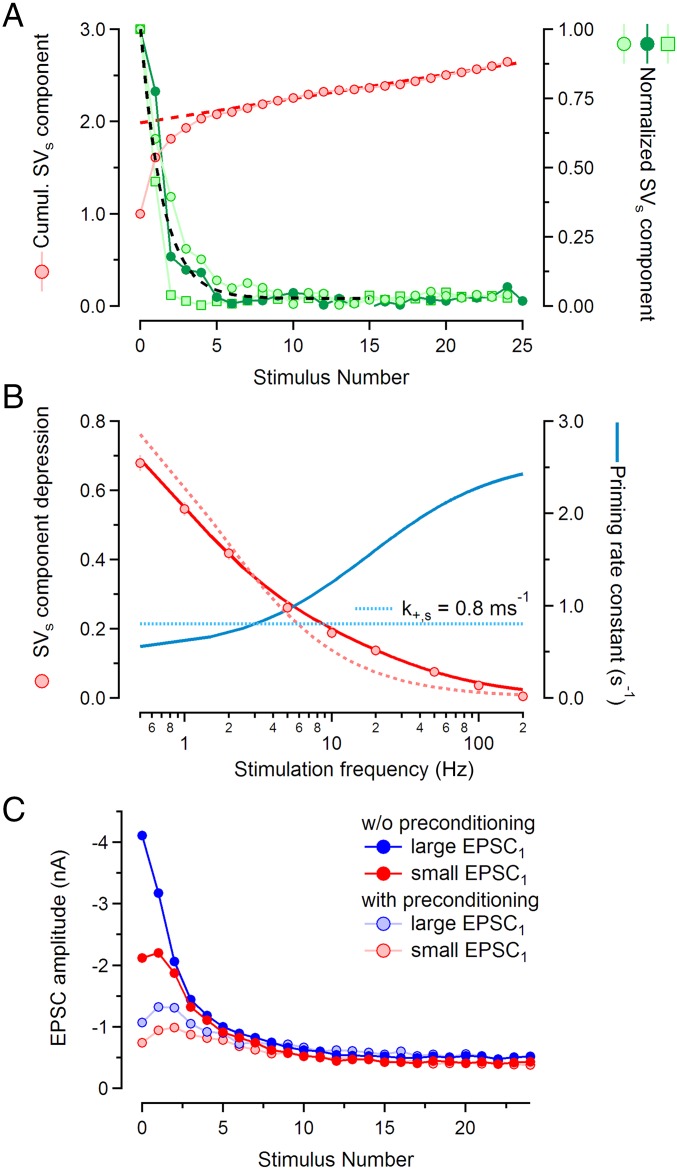
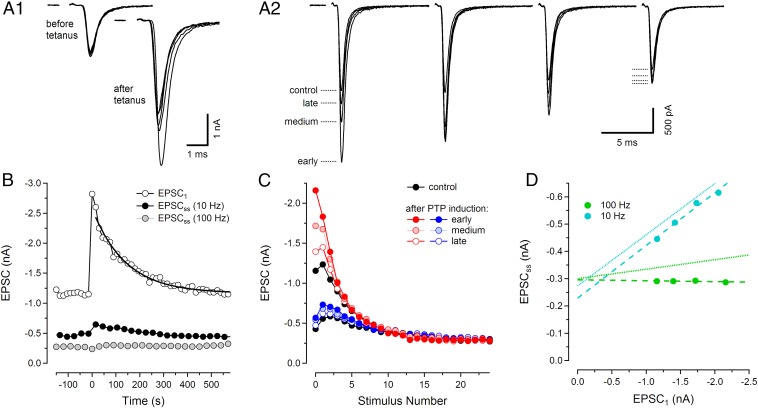
Glutamatergic synapses show large variations in strength and short-term plasticity (STP). We show here that synapses displaying an increased strength either after posttetanic potentiation (PTP) or through activation of the phospholipase-C-diacylglycerol pathway share characteristic properties with intrinsically strong synapses, such as (i) pronounced short-term depression (STD) during high-frequency stimulation; (ii) a conversion of that STD into a sequence of facilitation followed by STD after a few conditioning stimuli at low frequency; (iii) an equalizing effect of such conditioning stimulation, which reduces differences among synapses and abolishes potentiation; and (iv) a requirement of long periods of rest for reconstitution of the original STP pattern. These phenomena are quantitatively described by assuming that a small fraction of "superprimed" synaptic vesicles are in a state of elevated release probability (p ∼ 0.5). This fraction is variable in size among synapses (typically about 30%), but increases after application of phorbol ester or during PTP. The majority of vesicles, released during repetitive stimulation, have low release probability (p ∼ 0.1), are relatively uniform in number across synapses, and are rapidly recruited. In contrast, superprimed vesicles need several seconds to be regenerated. They mediate enhanced synaptic strength at the onset of burst-like activity, the impact of which is subject to modulation by slow modulatory transmitter systems.

Keywords: Munc13; calyx of Held; phorbol ester; posttetanic potentiation; short-term plasticity.


Conflict of interest statement

The authors declare no conflict of interest.

Figures

Fig. 1.
Fig. 1.
Variability of short-term plasticity among calyx synapses. (A–C, Upper) Sample EPSC trains recorded in three different calyx synapses (P13–15) in response to high-frequency afferent fiber stimulation (200 Hz, 50 stimuli). Insets in A–C show the initial 4 EPSCs of the trains at a faster timescale. The bath solution contained 2 mM Ca2+ and 1 mM kynurenic acid for all experiments illustrated here and in Figs. 2–5. (A–C, Lower) Average EPSC amplitudes of the same synapses for three different frequencies (50 Hz, 100 Hz, and 200 Hz) were calculated from three to four repetitions and plotted against stimulus number. For clarity, only the initial 15 EPSC amplitudes are plotted.
Fig. 2.
Fig. 2.
Paired-pulse ratios plotted as a function of EPSC1. EPSCs were measured in response to 100 Hz (green) and 200 Hz (blue) stimulus trains. Symbols with light colors represent EPSCs recorded under control conditions, and symbols with dark colors represent EPSCs recorded in the presence of 1µM PdBu. The dashed curve shows the prediction of a simple model as described in SI Text.
Fig. 3.
Fig. 3.
Dependence of EPSC amplitudes on stimulation frequency. (A) Variability disappears during high-frequency stimulation. Amplitudes of EPSCs during 200-Hz stimulus trains are plotted against stimulus number for two synapses. Blue symbols refer to a synapse with a large EPSC1 and red symbols to a weak synapse. Open symbols show amplitudes under control conditions and solid ones those after application of 1 µM PdBu. The curves converge toward similar steady-state values during stimulation. Convergence is not toward zero, but toward a common EPSCss of about −0.26 nA, as Inset shows at expanded y scale. (B) Superpriming is a slow process. Data from the same synapses as shown in A, but now obtained with 2-Hz stimulation, are plotted the same way. At such low frequencies, the heterogeneity among EPSC amplitudes is partially preserved at steady state. (C) Summary of data obtained from 23 synapses in a frequency range from 0.5 Hz to 200 Hz. EPSCsss (averages of the last 5 EPSCs) are plotted against EPSC1. Each symbol represents an individual synapse at a given frequency (color coded). Solid symbols are derived from experiments under PdBu, whereas open ones represent control conditions. The data for a given frequency are least-squares fitted by straight lines, the slopes of which change strongly with frequency. The line fits for lower frequencies (0.5–100 Hz) intersect at a common point (Inset reproduces the line fits without data points). The black dashed line is the identity line (slope = 1), which represents the case that EPSCss equals EPSC1 (no depression). Note that even the 0.5-Hz line fit has a slope lower than one.
Fig. 4.
Fig. 4.
Isolating the superprimed component of EPSCs. (A) Normalized time courses of contributions from superprimed SVs during 100-Hz trains are plotted against stimulus number (right ordinate). Three examples are shown, each of which was calculated as a difference between average 100-Hz train responses from a set of synapses with large EPSC1 minus the corresponding average from synapses with small EPSC1 multiplied by a weighting factor (0.87, 0.822, and 1.06 for the three traces). The lowest trace displays a very rapid decay toward zero, followed by some rebound. This may indicate some residual AMPAR desensitization that is relieved when quantal content is reduced toward steady state. The black dashed curve represents a least-squares fit of an exponential plus baseline to the average of the traces. Superimposed is the cumulative version of the average trace (red circles, left ordinate), together with a line fit to the amplitudes of EPSC11 to EPSC25. (B) Frequency dependence of the steady-state occupancy of the SVs pool. Slopes of line fits from Fig. 3C are plotted against the logarithm of the stimulus frequency (red symbols) together with an adequate fit (solid red curve) and a fit for a fixed priming rate constant of 0.8 s−1 (dotted light red curve). Superimposed are the rate constants used for the fits (blue curve, right ordinate). These were either fixed at 0.8 s−1 or else calculated with a Michaelis–Menten-type function (basal value 0.5 s−1, maximum value 2.4 s−1, K0.5 at 15 Hz). This combination of parameters was used together with ps = 0.5 (SI Text). (C) Conditioning stimulation converts depressing EPSC trains into facilitating ones. EPSC amplitudes during 100-Hz stimulus trains are plotted against stimulus number, for trains both without (symbols with dark colors) and with (symbols with light colors) preceding conditioning stimulation (10 stimuli, 10 Hz). Averages from two groups of synapses (three each) are shown, one with large EPSC1 (mean = −4.11 nA, blue symbols) and one with smaller EPSC1 (mean = −2.12 nA, red symbols). Conditioning stimulation reduces differences in synaptic strength among synapses (ratio between EPSC1 values was 1.94 and 1.45 for 100-Hz trains without and with conditioning 10-Hz stimulation, respectively). It turns STD into facilitation, revealing properties of the contribution of SVns.
Fig. 5.
Fig. 5.
Posttetanic potentiation of EPSCs can be explained by enhanced superpriming of SVs. (A) EPSCs recorded before and at various time points after induction of PTP, which was induced by 8 s of tetanic stimulation (200 Hz). Before and after PTP induction, 100-Hz trains were delivered every 15 s, alternating with and without conditioning 10-Hz stimulation. (A1) Five individual EPSC1s recorded every 60 s before (Left) and every 15 s after (Right) delivering a 200-Hz tetanus. (A2) Superimposed EPSC trains at 100 Hz stimulation, recorded before and at three time intervals after PTP induction. For clarity, only the initial four EPSCs are shown. EPSC traces are averages of five (before), two (early), three (medium), and two (late) individual trains (exact timing in SI Text). (B) Average time course of PTP induction and decay obtained from seven synapses. EPSC1 amplitudes are plotted against start time of stimulus trains, relative to the time of PTP induction (open circles). An exponential was fitted to the decay time course of the EPSC1 amplitudes, starting with the second EPSC1 recorded after PTP induction (thick solid curve). In addition, EPSCsss are shown for 10 Hz (black circles, average of EPSC6 to EPSC10) and for 100 Hz (gray circles, average of EPSC21 to EPSC25). (C) Average EPSC amplitudes during 100-Hz stimulation are plotted against stimulus number, for trains both without (red curves and upper black curve) and with (blue curves and lower black curve) preceding conditioning stimulation (10 stimuli, 10 Hz). Averages were calculated for the same early, medium, and late time points as chosen in A2. (D) Average EPSCsss before and at early, medium, and late time points after PTP induction were calculated as in B and plotted against the corresponding EPSC1 for both 100 Hz (green circles) and 10 Hz (cyan circles). Superimposed on the data are both regression lines to the scatter plots (dashed lines) and, for comparison, the corresponding line fits from Fig. 3C (dotted lines).
Fig. 6.
Fig. 6.
Imaging glutamate release from hippocampal boutons. (A) Dendrites of hippocampal neurons expressing iGluSnFR were imaged at 100 Hz during which 15 APs were elicited at 10 Hz. A, Left is overlaid with a color-coded map showing localization of release onto the dendrites. A, Right is overlaid with a map indicating the measured PPR for a given release site. (Scale bar, 10 µm.) (B) Individual normalized fluorescence traces from a single release site in response to the train stimuli are plotted in gray. The mean of 10 repetitions is plotted in black. Responses to individual stimuli overlap due to limited time resolution of the indicator. (B, Lower) Deconvolution of the mean fluorescence trace recovers the average response for a given stimulus. (C and D) Peak amplitudes of deconvolved average responses (shown in B) of all boutons from a representative recording without preconditioning (C) and with preconditioning (D) are plotted in gray. The black dashed line represents the mean of all boutons. In C and D, Lower, the response amplitudes are normalized to the mean of the last five responses in the trains.
Fig. S1.
Fig. S1.
Spatial correlation of PPR between neighboring boutons. Release site pairs were grouped into 2.5-µm bins and cross-correlation of corresponding PPR values was performed. The mean ± SEM of correlation coefficients recovered from all measurements (n = 9) is plotted for pairs up to 50 µm apart. The decay of correlation with increasing distance was fitted with a single exponential (Inset) and a PPR correlation length constant of 4.1 µm (95% confidence interval: 2.6, 5.7) was determined. Error bars indicate SD.

Similar articles

Cited by

References

    1. Zucker RS, Regehr WG. Short-term synaptic plasticity. Annu Rev Physiol. 2002;64:355–405. - PubMed
    1. Chanda S, Xu-Friedman MA. Excitatory modulation in the cochlear nucleus through group I metabotropic glutamate receptor activation. J Neurosci. 2011;31(20):7450–7455. - PMC - PubMed
    1. Billups B, Graham BP, Wong AY, Forsythe ID. Unmasking group III metabotropic glutamate autoreceptor function at excitatory synapses in the rat CNS. J Physiol. 2005;565(Pt 3):885–896. - PMC - PubMed
    1. Brenowitz S, Trussell LO. Minimizing synaptic depression by control of release probability. J Neurosci. 2001;21(6):1857–1867. - PMC - PubMed
    1. Wang T, Rusu SI, Hruskova B, Turecek R, Borst JG. Modulation of synaptic depression of the calyx of Held synapse by GABA(B) receptors and spontaneous activity. J Physiol. 2013;591(19):4877–4894. - PMC - PubMed

Publication types