. 2016 Aug 2;113(31):8801-6.
doi: 10.1073/pnas.1602978113. Epub 2016 Jul 18.

HIF2α-arginase axis is essential for the development of pulmonary hypertension

Affiliations

HIF2α-arginase axis is essential for the development of pulmonary hypertension

Andrew S Cowburn et al. Proc Natl Acad Sci U S A. .

Abstract

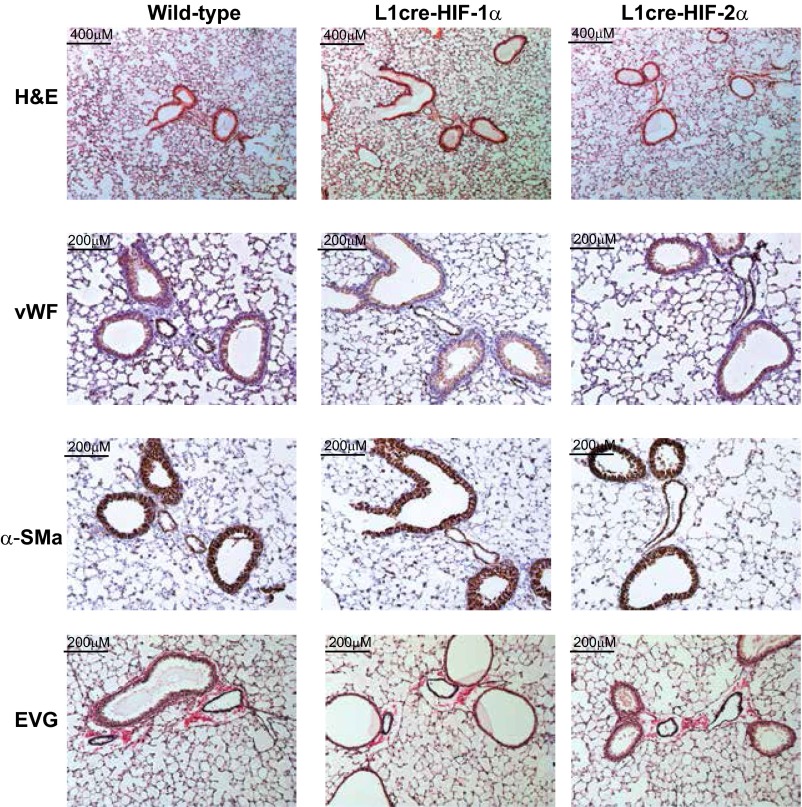
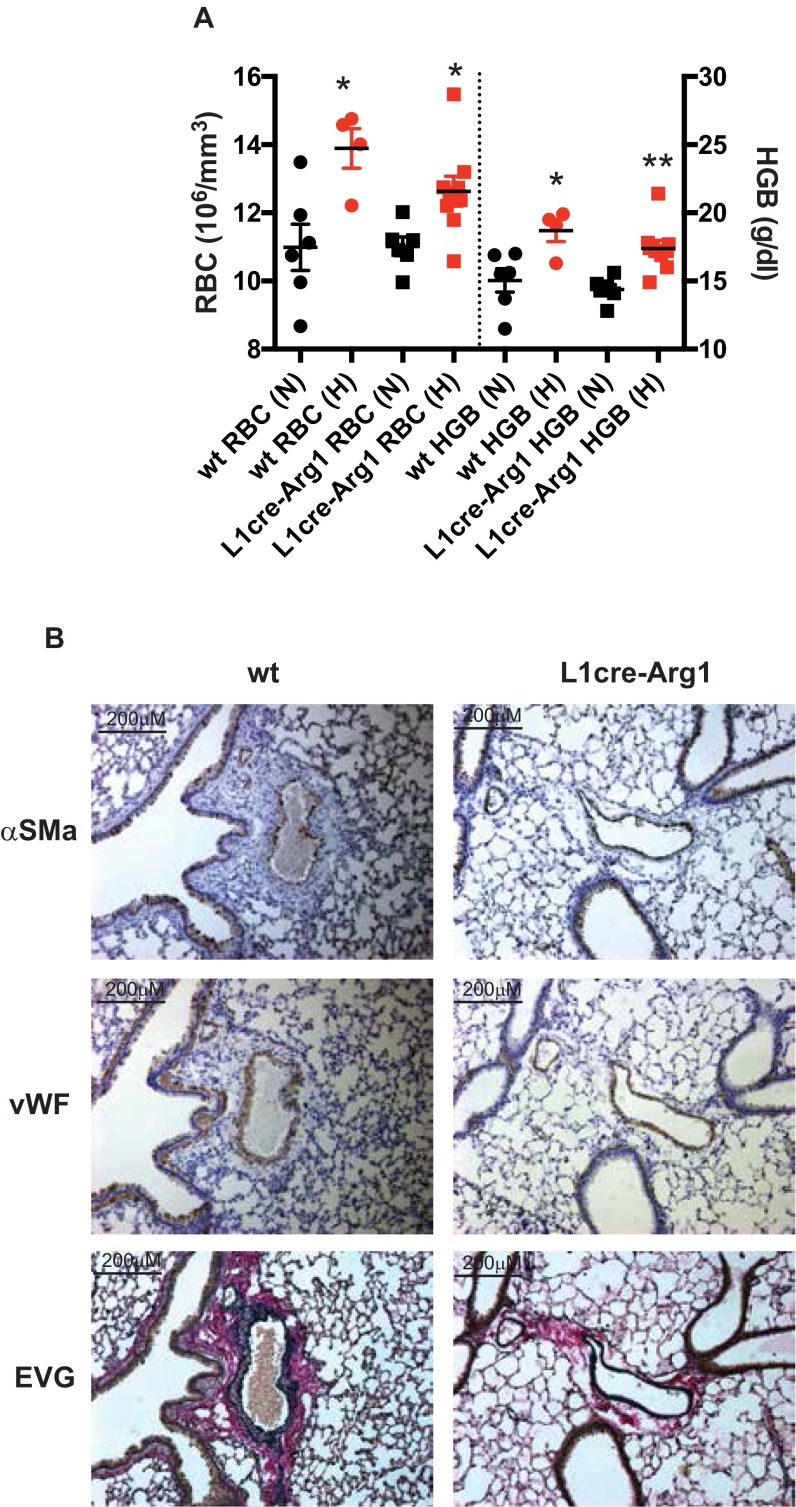
Hypoxic pulmonary vasoconstriction is correlated with pulmonary vascular remodeling. The hypoxia-inducible transcription factors (HIFs) HIF-1α and HIF-2α are known to contribute to the process of hypoxic pulmonary vascular remodeling; however, the specific role of pulmonary endothelial HIF expression in this process, and in the physiological process of vasoconstriction in response to hypoxia, remains unclear. Here we show that pulmonary endothelial HIF-2α is a critical regulator of hypoxia-induced pulmonary arterial hypertension. The rise in right ventricular systolic pressure (RVSP) normally observed following chronic hypoxic exposure was absent in mice with pulmonary endothelial HIF-2α deletion. The RVSP of mice lacking HIF-2α in pulmonary endothelium after exposure to hypoxia was not significantly different from normoxic WT mice and much lower than the RVSP values seen in WT littermate controls and mice with pulmonary endothelial deletion of HIF-1α exposed to hypoxia. Endothelial HIF-2α deletion also protected mice from hypoxia remodeling. Pulmonary endothelial deletion of arginase-1, a downstream target of HIF-2α, likewise attenuated many of the pathophysiological symptoms associated with hypoxic pulmonary hypertension. We propose a mechanism whereby chronic hypoxia enhances HIF-2α stability, which causes increased arginase expression and dysregulates normal vascular NO homeostasis. These data offer new insight into the role of pulmonary endothelial HIF-2α in regulating the pulmonary vascular response to hypoxia.

Keywords: HIF; hypertension; hypoxia; pulmonary.


Conflict of interest statement

The authors declare no conflict of interest.

Figures

Fig. S1.
Fig. S1.
L1cre specificity for pulmonary endothelial cells. Representative photomicrographs from three independent mice (A) show bright-field structure of frozen lung (cre-/cre+), heart (cre+), kidney (cre+), and liver (cre+) sections, immunohistochemistry staining red for podocalyxin (vasculature), green td-RFP (cre+ activity), and merged image. (B) L1cre deletion efficiency of HIF-2α in isolated pulmonary endothelial cells and other selected whole organs. Isolated endothelial data shown as single experiment from six pooled animals.
Fig. 1.
Fig. 1.
Pulmonary endothelial HIF-2α contributes to chronic hypoxic pulmonary hypertension. (A) Scatter plot (mean ± SEM) of RVSP. WT and L1cre-HIFα mice were housed in normoxia (N) or CH (H) [WT (N) n = 9, (H) n = 12; L1cre-HIF-1α (N) n = 6, (H) n = 7; L1cre-HIF-2α (N) n = 11, (H) n = 7]. (B) RVH. Scatter plot (mean ± SEM) shows RV/LV+S weight ratio in mice exposed to normoxia (N) or CH (H) [WT (N) n = 9, (H) n = 12; L1cre-HIF-1α (N) n = 6, (H) n = 7; L1cre-HIF-2α (N) n = 11, (H) n = 7]. (C and D) Airway remodeling in WT (n = 15), L1cre-HIF-1α (n = 7), and L1cre-HIF-2α (n = 7) postchronic hypoxic challenge. (C) Scatter plot (mean ± SEM) of pulmonary vessel medial thickness. Quantification of the intimal medial thickness achieved by staining lung sections with elastic van Gieson (EVG). (D) Histological sections immunostained with α-SMA, von Willebrand factor (vWF), and EVG. Representative photomicrographs demonstrate lack of remodeling in L1cre-HIF-2α pulmonary arteries associated with terminal bronchi. Loss of HIF-2α in pulmonary endothelial cells reduces the degree of muscularization of peripheral arteries. (Scale bars, 200 μM.) (E) Stacked bar chart showing muscularization of peripheral pulmonary arteries in lung sections (blue bar, full muscle ring; green bar, partial muscle ring; and yellow bar, no muscle ring) from WT (n = 15), L1cre-HIF-1α (n = 9), and L1cre-HIF-2α (n = 7) mice. (F) Representative photomicrographs immunostained for α-smooth muscle (arrows point to distal vessels). (Scale bars, 100 μM.) *P < 0.05, **P < 0.001, ***P < 0.0001.
Fig. S2.
Fig. S2.
Hematological and body weight response to CH, and a hypoxic time course of endothelial HIF1α deletion. (A) RBC counts, hemoglobin (HGB) scores, and (B) WBC counts did not deviate between the groups. Data are shown as scatter graph as mean ± SEM of RBC, HGB, and WBC from normoxic (N)- and chronic hypoxic (H)-housed WT (n = 9 and n = 15), L1cre-HIF-1α (n = 9 and n = 8), and L1cre-HIF-2α (n = 7 and n = 8). (C) Bar graph of mean ± SEM body weight, normoxic (N) and after CH (H), from WT (n = 8), L1cre-HIF-1α (n = 7), and L1cre-HIF-2α (n = 8). Deletion of endothelial HIF1α did not modulate the development of RVH (D) or the accumulation of RBCs (E) compared with WT control throughout the hypoxic time course of 7, 14, and 21 d. Data are shown as scatter graph as mean ± SEM of RV/LV+S and RBC counts for WT (n = 5–17) and L1cre-HIF-1α (n = 5–13).
Fig. S3.
Fig. S3.
Histological sections from paraffin wax-embedded lungs were immunostained for α-SMA and vWF and stained for H&E and EVG. Representative photomicrographs show no remodeling in normoxic-housed L1cre-HIF-1α or L1cre-HIF-2α mice compared with WT control.
Fig. S4.
Fig. S4.
Deletion of pulmonary endothelial HIF-2α or Arg-1 decreases collagen deposition around arteries associated with terminal bronchus. Histological lung sections were stained using Sirius red and then analyzed by imageJ software. Data are shown as a bar graph for (A) WT (open bar, n = 7), L1cre-HIF-1α (blue bar, n = 6), and L1cre-HIF-2α (red bar, n = 7) and (B) WT (open bar, n = 5) and L1cre-Arg-1 (green bar, n = 6) and representative photomicrographs show the degree of collagen deposition following chronic hypoxic challenge. **P < 0.001.
Fig. 2.
Fig. 2.
Endothelial deletion of HIF-2α maintains higher plasma nitrate levels. (A) Quantitative PCR (qPCR) analysis of arginase-I/-II, NOS2, and VEGF mRNA from whole lung samples of WT (open bar, n = 7), L1cre-HIF-1α (blue bar, n = 7), and L1cre-HIF-2α (red bar, n = 6). (B and C) Total NO in (B) plasma and (C) whole lung by the conversion of NO(X) to NO using an NO analyzer (Sievers). Data shown as scatter plot with mean ± SEM from WT (n = 7), L1cre-HIF-1α (n = 7), and L1cre-HIF-2α (n = 6) after CH challenge. (C) Whole lung lysate analysis for NO(X) in normoxic WT (open bar, n = 7), L1cre-HIF2α (red bar, n = 7), and L1cre-Arg1 (green bar, n = 4) and following CH (10% O2 21 d), WT (white checkered bar, n = 16), L1cre-HIF2α (red checkered bar, n = 7), and L1cre-Arg1 (green checkered bar, n = 9). (D) Exhaled NO was measured noninvasively in nonanesthetized mice. In normoxia gas phase NO was measured by a chemiluminescence-based NO analyzer (carrier gas baseline 1.7 ppb, dotted line). Data shown as bar graph with mean ± SEM for normoxic WT (n = 13), L1cre-HIF-2α (n = 8), and L1-Arg1(n = 5). Pulmonary endothelial deletion of Arg-1 attenuates hypoxic pulmonary hypertensive phenotype. (E) Scatter plot (mean ± SEM) shows the effect of pulmonary endothelial Arg-1 on RVSP. WT and L1cre-Arg1 mice were housed in normoxia (N) or CH (H) [WT (N) n = 5, (H) n = 7; L1cre-Arg1 (N) n = 6, (H) n = 7]. (F) Effect of pulmonary endothelial Arg-1 on RVH. Scatter plot (mean ± SEM) shows RV/LV+S weight ratio in mice exposed to normoxia (N) or CH (H) [WT (N) n = 6, (H) n = 6; L1cre-Arg1 (N) n = 7, (H) n = 9]. (G) Airway remodeling was determined in WT (n = 8) and L1cre-Arg1 (n = 10). Quantification of the intimal medial thickness. (H) Stacked bar chart showing the degree of muscularization of peripheral pulmonary arteries in lung sections from WT (n = 5) and L1cre-Arg1 (n = 6) mice. (I) Representative photomicrographs immunostained for α-SMA showing near and complete ring formation in peripheral vessel of WT mice compared with L1cre-Arg1 mice. (Scale bars, 100 μM.) (J) Total NO was determined in the plasma by the conversion of NOx to NO using an NO analyzer (Sievers). Data shown as scatter plot with mean ± SEM from WT (n = 6) and L1cre-Arg1 (n = 8) after CH challenge. *P < 0.05, **P < 0.001, ***P < 0.0001.
Fig. S5.
Fig. S5.
Arginase and ET-1 expression in isolated pulmonary endothelial cells and whole lung. (A and B) qPCR data from a single experiment of six pooled animals; pulmonary endothelial cells isolated from WT or L1cre-HIF-2α mice cultured in normoxia or hypoxia for 24 h. (C) qPCR analysis of ET-1 expression in whole lung tissue from WT (n = 15), L1cre-HIF-1α (n = 7), and L1cre-HIF-2α (n = 6) mice following chronic hypoxic challenge. (D) Acute hypoxic increase in plasma ET-1 was inhibited in the L1cre-HIF1α (n = 4) and L1cre-HIF2α (n = 4) mice compared with WT (n = 6). Plasma ET-1 was significantly lower in L1cre-HIF2α (n = 8) compared with WT (n = 8) following chronic hypoxic challenge. Data are shown as mean ± SEM. (E) Exhaled NO was measured noninvasively in nonanesthetized mice following CH, and gas phase NO was measured by a chemiluminescence-based NO analyzer. Data are shown as a scatter graph with mean ± SEM. WT, n = 6; L1cre-HIF-2α, n = 6; and L1-Arg1, n = 5. *P < 0.05.
Fig. S6.
Fig. S6.
Endothelial deletion of HIFα does not influence the hypoxic modulated expression of PDGFα/β or PDGF-receptor A/B. qPCR data (fold change) for PDGFα/β and PDGF receptor A/B expression in whole lung from WT (n = 8–16) (A and C) L1cre-HIF-1α (n = 8) and (B and D) L1cre-HIF-2α (n = 8). (EH) qPCR data (fold change) for stem cell markers nanog, oct3-4, klf4, and sox2 are shown for WT (n = 8) and L1re-HIF2α (n = 8). Data are shown over a hypoxic time course of 0, 1, 3, and 21 d. *P < 0.05.
Fig. S7.
Fig. S7.
RBC counts and hemoglobin (HGB) did not deviate between the groups. (A) Data are shown as a scatter graph as mean ± SEM of RBC and HGB from normoxic (N)- and chronic hypoxic (H)-housed WT [n = 6 (N) and 4 (H)] and L1cre-Arg1 [n = 6 (N) and n = 9 (H)]. (B) Histological sections of lung were immunostained with α-SMA, vWF, and EVG. Representative photomicrographs demonstrate the remarkable attenuation of remodeling in L1cre-Arg1 pulmonary arteries associated with terminal bronchi compared with WT control.
Fig. 3.
Fig. 3.
Acute HPV is significantly blunt in L1cre-HIF-2α mutants. (A) Line diagram showing the time line and gas composition used to determine the acute HPV response. (B) Acute HPV was determined by measuring RVSP before and during acute hypoxic challenge (10% O2). The delta between the two pressures was determined as the hypoxic vasoconstriction response. Data shown in bar graph as mean ± SEM from WT (n = 13), L1cre-HIF-1α (n = 7), and L1cre-HIF-2α (n = 13). (C) Percentage arterial oxygen saturation was recorded during the acute hypoxic challenge. Data recorded at 5-s intervals mean ± SEM of WT (n = 7) and L1cre-HIF-2α (n = 7). (D) Ventilation rate in response to acute hypoxia was determined by whole-body plethysmography. Resting/normoxic ventilation was determined 60 min before acute hypoxic stimulus. Data shown as mean BrPM ± SEM for WT (n = 10), L1cre-HIF-1α (n = 5), and L1re-HIF-2α (n = 6). *P < 0.05.
Fig. S8.
Fig. S8.
Pulmonary respiratory response to acute hypoxia. (AC) Minute volume, tidal volume, and flow rate in response to hypoxia were determined by whole-body plethysmography. Data are shown as mean ± SEM for WT (n = 10), L1cre-HIF-1α (n = 5), and L1cre-HIF-2α (n = 6). Pulmonary endothelial HIF-2α does not influence carotid body development. (D and E) Representative photomicrographs showing immunostaining of TH+ cells in the carotid bifurcation of WT (n = 5) and L1cre-HIF-2α (n = 5). To facilitate comparison, the areas inside the rectangles are shown at a higher magnification. CB, carotid body; ECA, external carotid artery; ICA, internal carotid artery; SCG, superior cervical ganglion. (Scale bars, 200 μm and 20 μm.) Quantification of (F) CB TH+ cells, (G) carotid body volume, and (H) CB TH+ cells per area of tissue.
Fig. 4.
Fig. 4.
Analysis of human BOECs as a model for studying in vitro endothelial function in PAH. (A) Western blot analysis of HIF1α and HIF2α stability and arginase-2 expression in normoxia and 16 h posthypoxia. Data shown in bar graph as a ratio of target gene to β-actin, mean ± SEM of control (closed bar, n = 3) and PAH (red bar, n = 4). (B) A lentiviral shRNA strategy was used to target HIF1α, HIF2α, and Arg-2 expression. Three shRNAs were used to knock down each gene of interest. A scramble short hairpin and GFP-tagged lentivirus and no treatment were included as controls. Data shown (mean ± SEM qPCR fold change compared with no-treatment control) for Arg-2 from control (black bar, n = 3) and PAH (red bar, n = 3) 16 h posthypoxia. (C) Cell lysates were analyzed for arginase activity following the shRNA strategy to knock down HIF1α, HIF2α, and Arg-2. Data are shown as mean ± SD of urea produced corrected per milligram of protein lysate for control (black bar n = 2) and PAH (red bar n = 2). *P < 0.05, **P < 0.001 (control) and *P < 0.05, **P < 0.001(PAH).
Fig. S9.
Fig. S9.
Analysis of human BOECs for arginase-2 expression and activity and NO synthesis. (A) qPCR analysis of arginase-2; data are shown as mean ± SEM from control (open bar n = 3) and PAH (red bar n = 4). (B) Arginase activity assay data are shown as mean ± SEM from control (open bar n = 4) with or without arginase inhibitor (BEC) (black checkered bar, n = 4) and PAH (red bar n = 3) with or without arginase inhibitor (BEC) (red and black checkered bar). (C) NO analysis of whole-cell lysates from BOECs cultured for 48 h. Data are shown as mean ± SEM from control (open bar, n = 4) with or without arginase inhibitor (BEC) (black checkered bar, n = 4) and PAH (red bar, n = 3) with or without arginase inhibitor (BEC) (red and black checkered bar). A lentiviral shRNA strategy was used to target HIF1α, HIF2α, and Arg-2. Three different shRNAs were used to knock down each gene of interest; a scramble short hairpin, GFP-tagged lentivirus, and no treatment were included as controls. Data are shown (mean ± SEM qPCR fold change compared with no-treatment control) for (D) HIF1α and (E) HIF2α from control (black bar, n = 3) and PAH (red bar, n = 3) 16 h posthypoxia. **P < 0.001 (control) and **P < 0.001(PAH).

Similar articles

Cited by

References

    1. von Euler US, Liljestrand G. Observations on the pulmonary arterial blood pressure in the cat. Acta Physiol Scand. 1946;12(4):301–320.
    1. Sylvester JT, Shimoda LA, Aaronson PI, Ward JP. Hypoxic pulmonary vasoconstriction. Physiol Rev. 2012;92(1):367–520. - PMC - PubMed
    1. Naeije R. Pulmonary hypertension and right heart failure in chronic obstructive pulmonary disease. Proc Am Thorac Soc. 2005;2(1):20–22. - PubMed
    1. Lettieri CJ, Nathan SD, Barnett SD, Ahmad S, Shorr AF. Prevalence and outcomes of pulmonary arterial hypertension in advanced idiopathic pulmonary fibrosis. Chest. 2006;129(3):746–752. - PubMed
    1. Bärtsch P, Gibbs JS. Effect of altitude on the heart and the lungs. Circulation. 2007;116(19):2191–2202. - PubMed

Publication types

MeSH terms

Substances