. 2016 Aug 2;113(31):8855-60.
doi: 10.1073/pnas.1602582113. Epub 2016 Jul 18.

Plastidial metabolite MEcPP induces a transcriptionally centered stress-response hub via the transcription factor CAMTA3

Affiliations

Plastidial metabolite MEcPP induces a transcriptionally centered stress-response hub via the transcription factor CAMTA3

Geoffrey Benn et al. Proc Natl Acad Sci U S A. .

Abstract

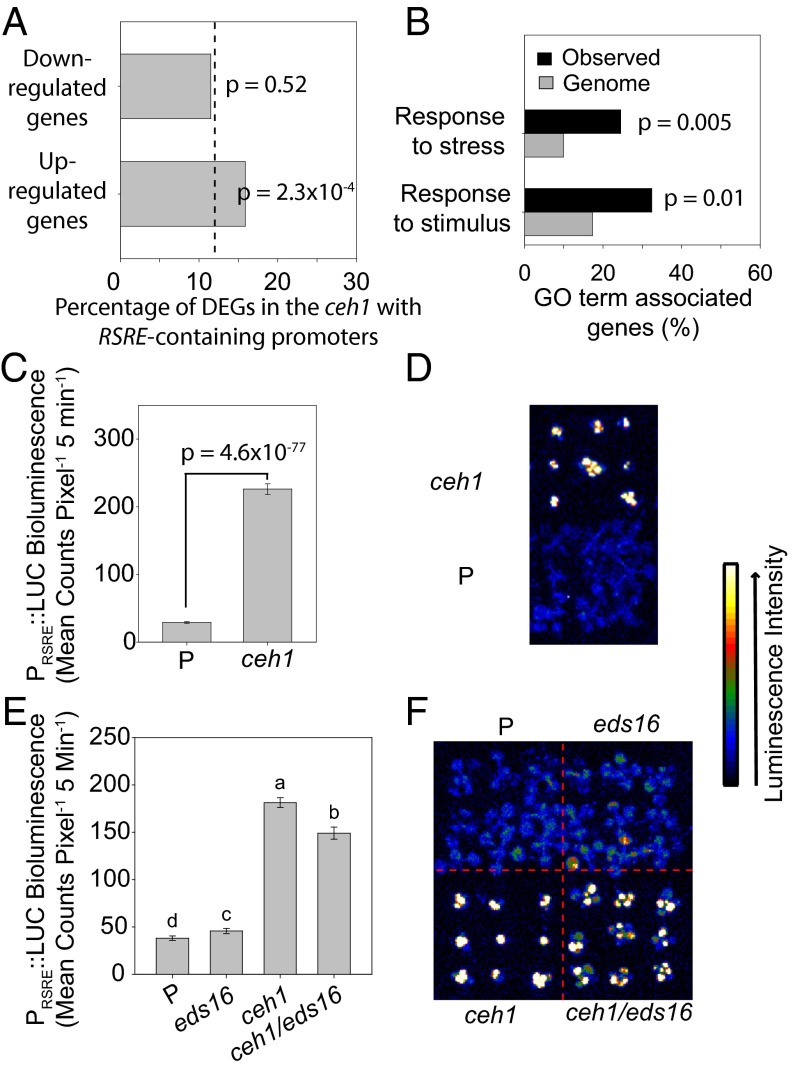
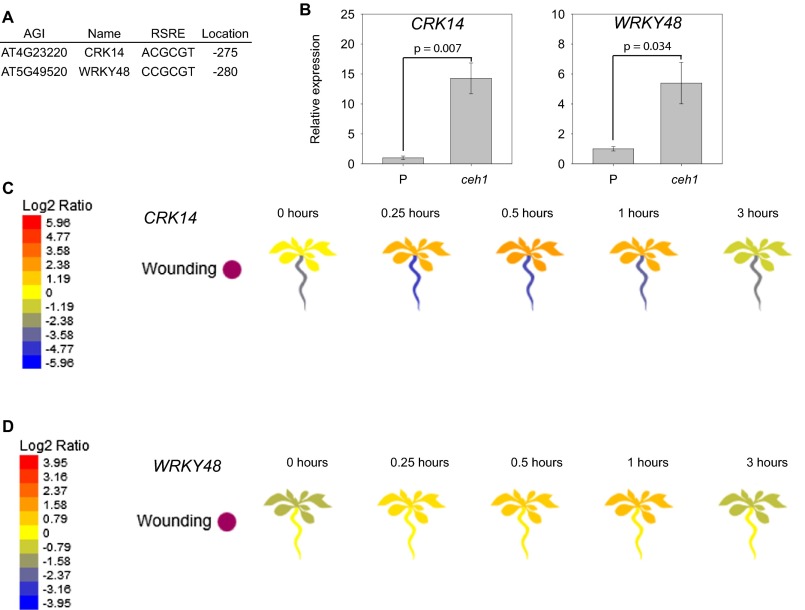
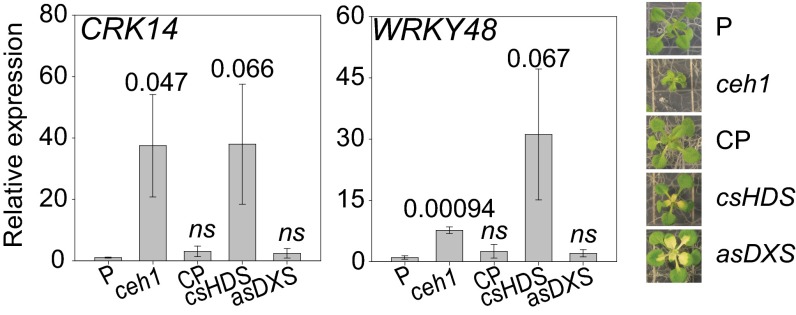
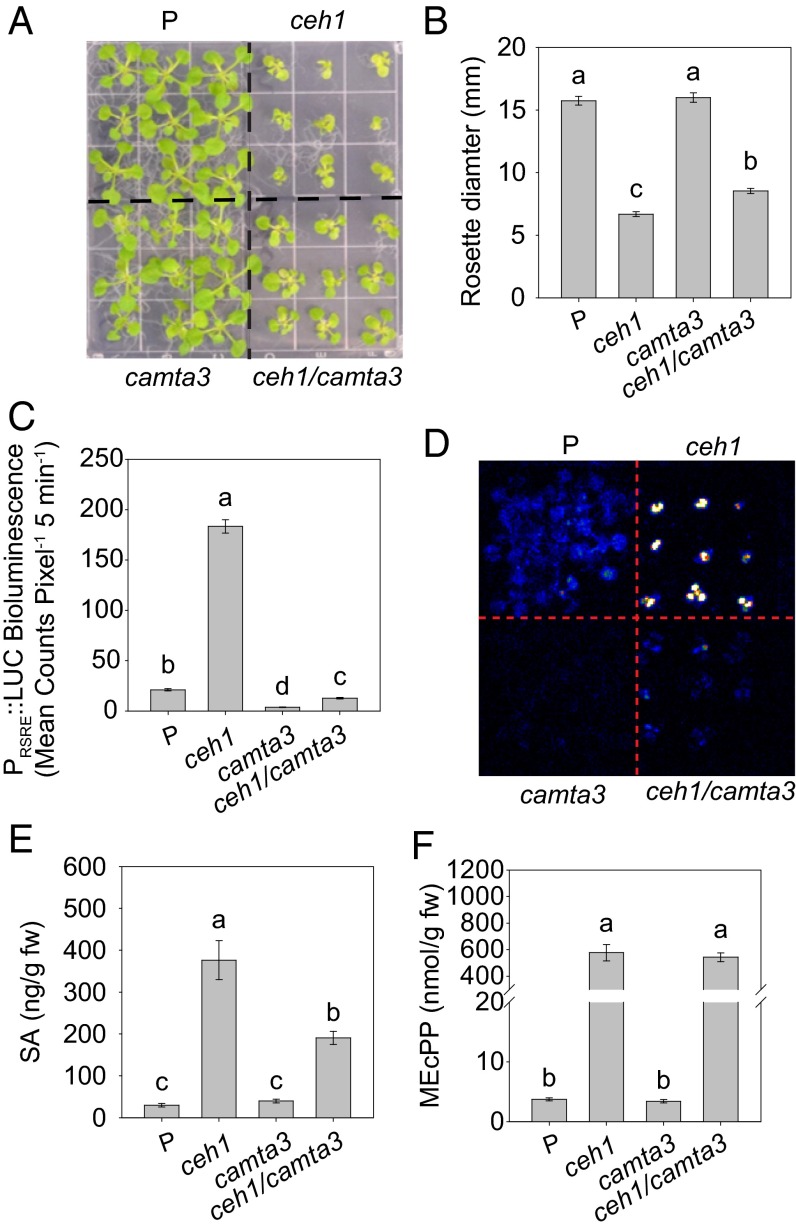
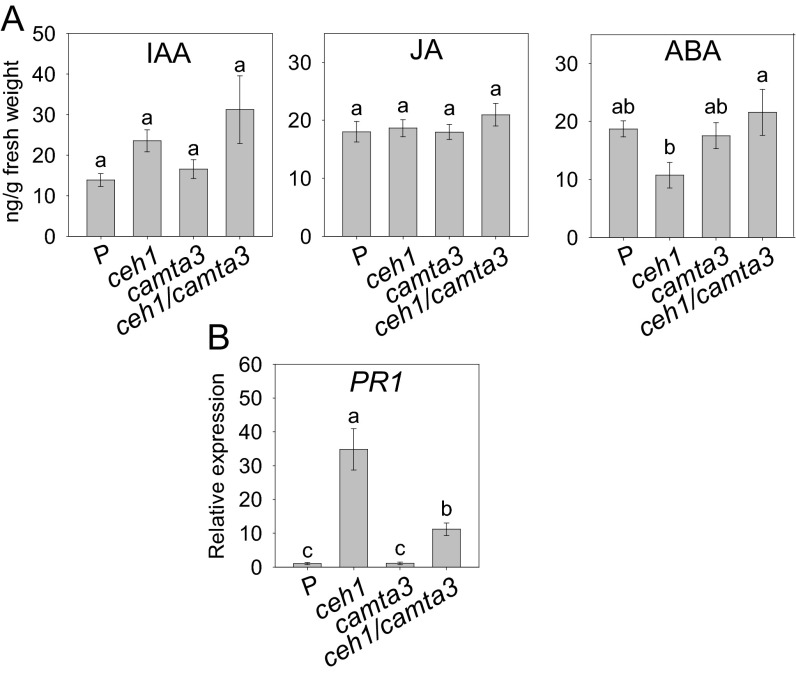
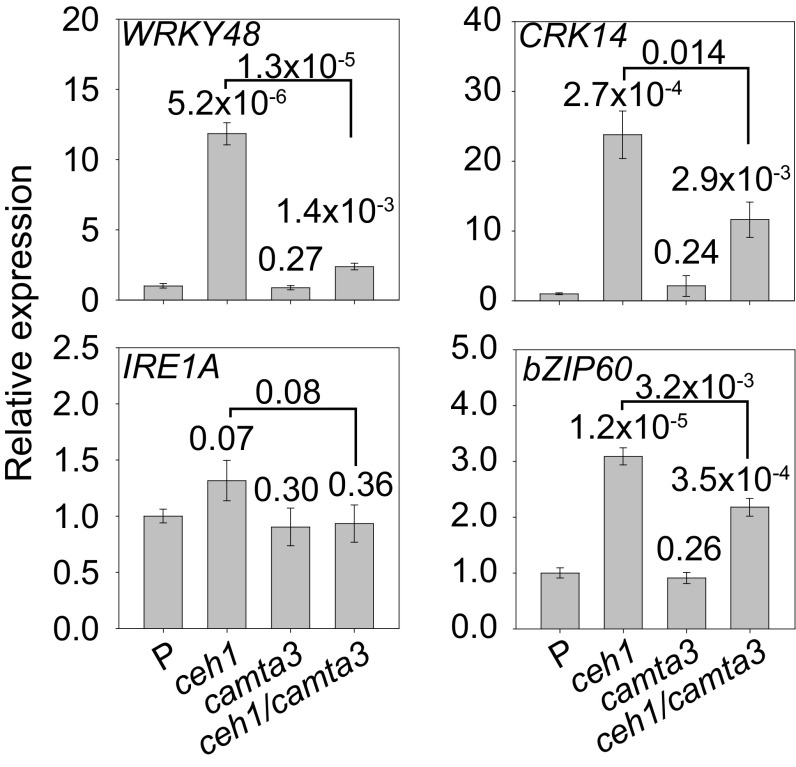
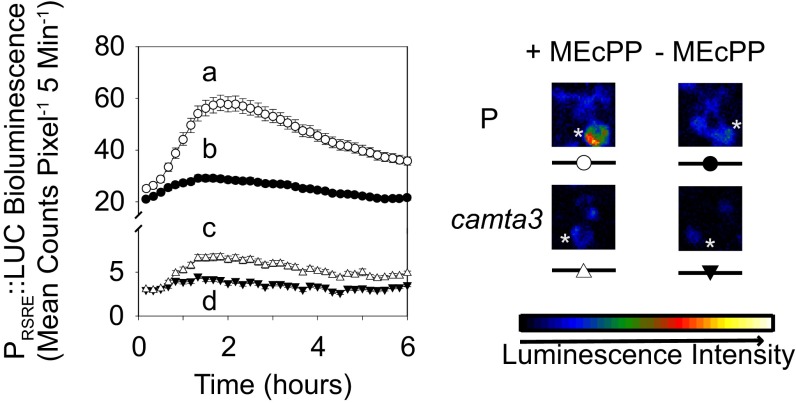
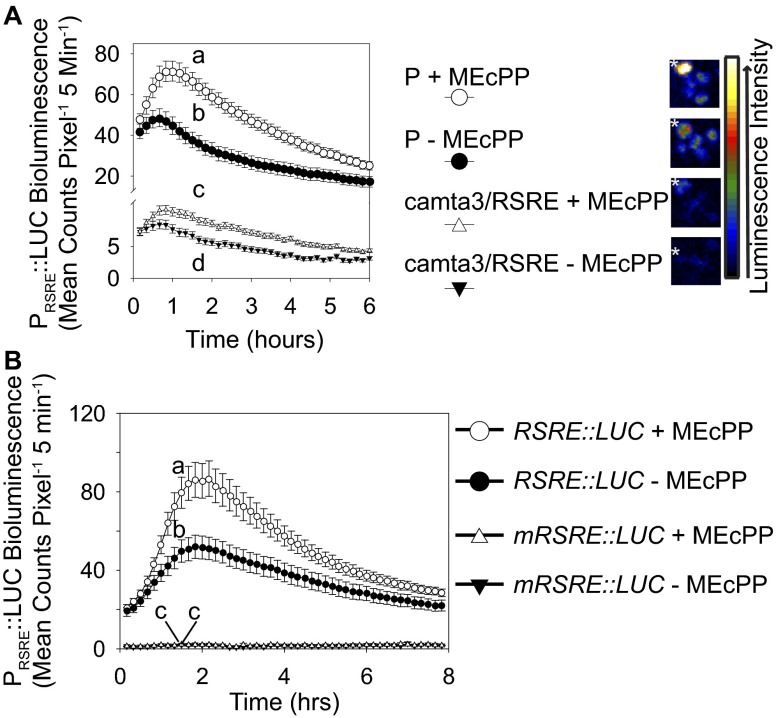
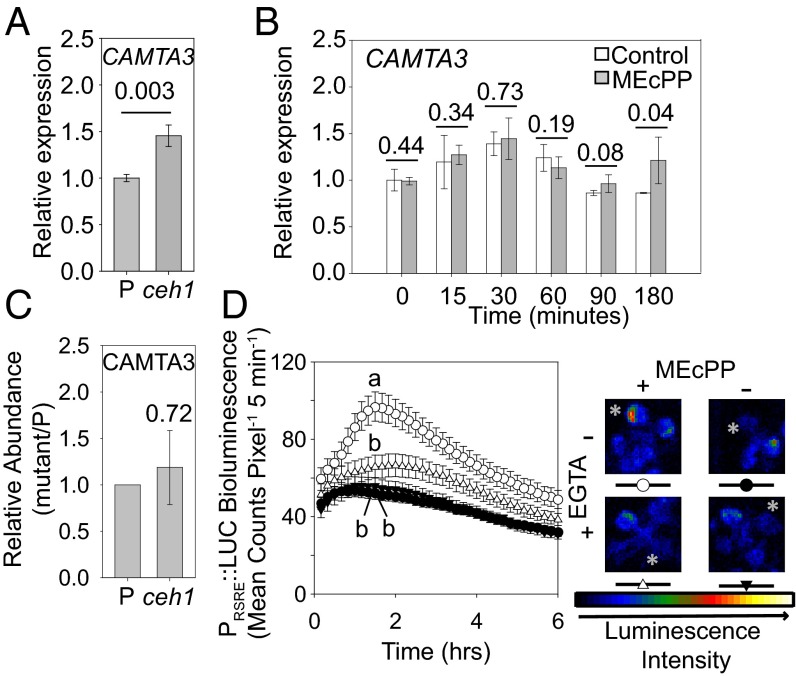
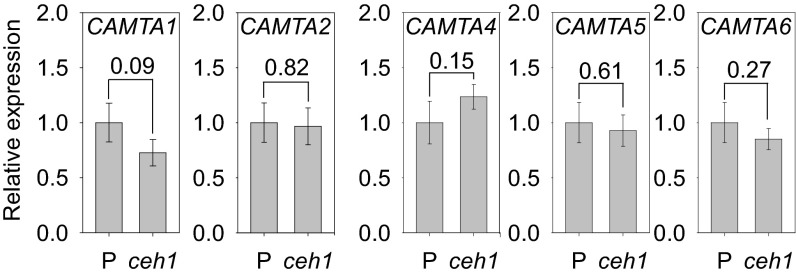
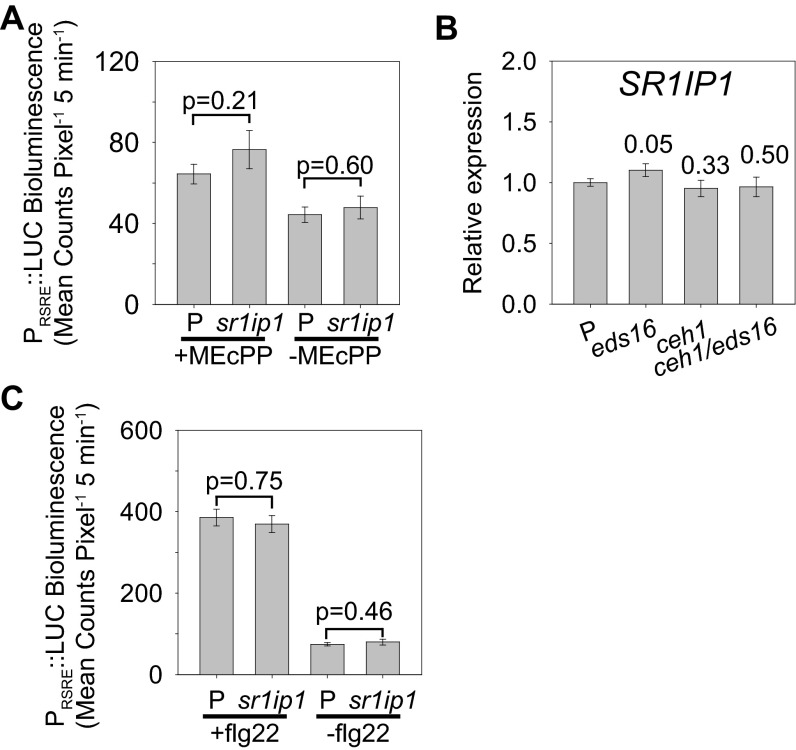
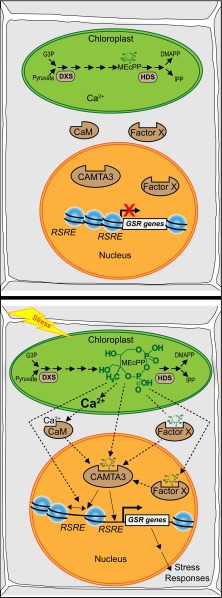
The general stress response (GSR) is an evolutionarily conserved rapid and transient transcriptional reprograming of genes central for transducing environmental signals into cellular responses, leading to metabolic and physiological readjustments to cope with prevailing conditions. Defining the regulatory components of the GSR will provide crucial insight into the design principles of early stress-response modules and their role in orchestrating master regulators of adaptive responses. Overaccumulation of methylerythritol cyclodiphosphate (MEcPP), a bifunctional chemical entity serving as both a precursor of isoprenoids produced by the plastidial methylerythritol phosphate (MEP) pathway and a stress-specific retrograde signal, in ceh1 (constitutively expressing hydroperoxide lyase1)-mutant plants leads to large-scale transcriptional alterations. Bioinformatic analyses of microarray data in ceh1 plants established the overrepresentation of a stress-responsive cis element and key GSR marker, the rapid stress response element (RSRE), in the promoters of robustly induced genes. ceh1 plants carrying an established 4×RSRE:Luciferase reporter for monitoring the GSR support constitutive activation of the response in this mutant background. Genetics and pharmacological approaches confirmed the specificity of MEcPP in RSRE induction via the transcription factor CALMODULIN-BINDING TRANSCRIPTION ACTIVATOR 3 (CAMTA3), in a calcium-dependent manner. Moreover, CAMTA3-dependent activation of IRE1a (inositol-requiring protein-1) and bZIP60 (basic leucine zipper 60), two RSRE containing unfolded protein-response genes, bridges MEcPP-mediated GSR induction to the potentiation of protein-folding homeostasis in the endoplasmic reticulum. These findings introduce the notion of transcriptional regulation by a key plastidial retrograde signaling metabolite that induces nuclear GSR, thereby offering a window into the role of interorgannellar communication in shaping cellular adaptive responses.

Keywords: CAMTA3; GSR; MEcPP; RSRE; retrograde signals.


Conflict of interest statement

The authors declare no conflict of interest.

Figures

Fig. 1.
Fig. 1.
The constitutive activation of GSR is specific to the ceh1 and does not depend on SA. (A) Proportion of DEGs in the ceh1 mutant containing an RSRE in the proximal 500 bp of the promoter region. The dashed line represents the proportion of genes on the ATH1 genome array with RSRE-containing promoters. P values were determined via the hypergeometric distribution. (B) Enrichment of selected GO terms in RSRE-containing genes induced in ceh1 (observed); P values were determined using false-discovery rate (FDR)-corrected Fisher’s exact test. (C) Basal RSRE:LUC activity in parent (P) and ceh1 seedlings. Data are presented as means ± SEM (n ≥ 123) with the P value determined using a two-tailed Student’s t test. (D) Representative darkfield images of P and ceh1 plants expressing RSRE:LUC. (E) Basal RSRE:LUC activity in the listed genotypes. Data are presented as means ± SEM (n ≥ 123). Bars that do not share a letter represent statistically significant differences as determined by Tukey’s honestly significant difference (HSD) test (P < 0.05). (F) Representative darkfield images of plants of each genotype expressing RSRE:LUC. The color-coded bar displays the intensity of LUC activity.
Fig. S1.
Fig. S1.
CRK14 and WRKY48 are RSRE-containing GSR marker genes. (A) The position and sequence of the RSRE motif in the promoters of CRK14 and WRKY48 relative to the translational start site. (B) Relative expression levels of CRK14 and WRKY48 in P and ceh1 plants confirming the microarray analysis described. (C and D) Visualization by eFP browser (bar.utoronto.ca/efp/cgi-bin/efpWeb.cgi) of the relative expression levels of CRK14 (C) and WRKY48 (D) in response to wounding.
Fig. S2.
Fig. S2.
Constitutive induction of GSR genes is specific to the modulation of HDS. (Left) Relative expression of CRK14 and WRKY48 in the P, ceh1, ceh1-complementation (CP), HDS cosuppression (csHDS), and DXS antisense (asDXS) lines. (Right) Corresponding representative plants. Data are presented as means ± SEM (n = 3). P values were determined by one-tailed t tests. Values greater than P = 0.1 are labeled as nonsignificant (ns).
Fig. 2.
Fig. 2.
In plants containing high levels of MEcPP, the GSR is induced via the transcription factor CAMTA3. (A and B) Representative images of the examined genotypes (P, ceh1/RSRE, camta3/RSRE, and ceh1/camta3/RSRE) (A), and average rosette diameter (B). Data are presented as means ± SEM (n ≥ 65). (C) Basal RSRE:LUC activity in aforementioned seedlings. Data are presented as means ± SEM (n ≥ 123) with the P value determined using the two-tailed t test. (D) Darkfield image analysis of representative plants expressing transcriptional RSRE:LUC. (E and F) Levels of SA (E) and MEcPP (F) in the genotypes examined. Data are presented as the means ± SEM of four independent biological replicates. Bars that do not share a letter represent statistically significant differences as determined by Tukey’s HSD test (P < 0.05).
Fig. S3.
Fig. S3.
Expression levels of PR1 are reduced in the ceh1/camat3 background. (A) Levels of auxin (IAA), jasmonic acid (JA), and abscisic acid (ABA) in each genotype examined on four biological replicates. Data are presented as means ± SEM (n = 4). Bars that do not share a letter represent statistically significant differences as determined by Tukey’s HSD test. (B) Relative expression of PR1 in each genotype by qRT-PCR. Data are presented as means ± SEM (n = 4).
Fig. 3.
Fig. 3.
The expression of GSR and UPR genes in the ceh1 line is induced predominantly via CAMTA3. Relative expression levels of two GSR marker genes (WRKY48 and CRK14) and two of the UPR genes (IRE1a and bZIP60) analyzed by quantitative RT-PCR (qRT-PCR) in P, ceh1, camta3, and ceh1/camta3 lines. Data are presented as means ± SEM of four independent biological replicates. The numbers above each pair of bars are P values from one-tailed t tests relative to the P line, unless otherwise indicated.
Fig. 4.
Fig. 4.
Exogenous application of MEcPP rapidly induces RSRE via CAMTA3. (Left) Activity of RSRE:LUC in P (upper curves) and camta3 (lower curves) leaves following application of MEcPP (open circles and triangles) or water as the control (filled circles and triangles). Data are shown as means ± SEM (n ≥ 187). Lines that do not share a letter represent statistically significant differences as determined by Tukey’s HSD test at the 90-min time point (P < 0.05). (Right) Representative plants are shown at right, with the treated leaves labeled by a white asterisk. The color-coded bar displays the intensity of LUC activity.
Fig. S4.
Fig. S4.
Exogenous application of MEcPP rapidly and specifically induces RSRE but not mRSRE via CAMTA3. (A, Left) Activity of RSRE:LUC in P and camta3 leaves following application of water as the control (filled circles and triangles) or 100 μM of commercial MEcPP (open circles and triangles). Data are presented as means ± SEM (n ≥ 70). (Right) Representative plants are shown, with the treated leaves labeled by a white asterisk. The color-coded bar displays the intensity of LUC activity. (B) Activity of RSRE:LUC (circles) and mRSRE:LUC (triangles) following application of water as the control (filled circles and triangles) or 100 uM MEcPP (open circles and triangles). Data are presented as means ± SEM (n ≥ 63). Lines in A and B that do not share a letter represent statistically significant differences as determined by Tukey’s HSD test at the 90-min time point.
Fig. 5.
Fig. 5.
Activation of RSRE by MEcPP is Ca2+ dependent. (A) Relative expression levels of CAMTA3 analyzed by qRT-PCR in the P and ceh1 lines. Data are presented as means ± SEM (n = 3), with the P value determined by the two-tailed t test. (B) Relative expression levels of CAMTA3 analyzed by RT-qPCR in P plants at different times after the application of water (white bars) or MEcPP (gray bars) to the leaves. Data are presented as means ± SEM (n = 3). P values from one-tailed t tests are shown above each pair of bars. (C) Normalized iTRAQ CAMTA3 protein abundance in ceh1 plants relative to P plants. Data are presented as means with the P value determined by the two-tailed t test. (D, Left) Activity of 4×RSRE:LUC in the P background following pretreatment with EGTA (triangles) or water (circles) and subsequent MEcPP application (open circles and triangles) or water as the control (filled circles and triangles). Data are shown as means ± SEM (n ≥ 111). Lines that do not share a letter represent statistically significant differences as determined by Tukey’s HSD test at the 90-min time point (P < 0.05). (Right) Representative plants are shown with the treated leaves labeled by a white asterisk. The color-coded bar displays the intensity of LUC activity.
Fig. S5.
Fig. S5.
CAMTA transition factors are not differentially regulated in the ceh1 line. Shown are the relative expression of CAMTA1, CAMTA2, CAMTA4, CAMTA5, and CAMTA6 in the previously described P and ceh1 lines. qRT-PCR data are shown as means ± SEM (n = 3). P values from two-tailed t tests are shown above each pair of bars.
Fig. S6.
Fig. S6.
SR1IP1 is not required for the RSRE:LUC response to flg22 and is not differentially regulated in ceh1. (A) RSRE::LUC activity in P and sr1ip1 90 min after the application of 100 μM MEcPP or water (control). Data are presented as means ± SEM (n ≥ 121). (B) Relative expression levels of SR1IP1 in P, eds16-1, ceh1, and ceh1/eds16-1 lines. The numbers above the bars are P values from two-tailed t tests with P. Data are presented as means ± SEM (n = 3). (C) The LUC activity in P and sr1ip1/RSRE:LUC treated with 0.5 um flg22 (+flg22) or with SilWet as the control (−flg22). Data are presented as means ± SEM (n ≥ 45). The P values above each pair of bars are from one-way ANOVA.
Fig. 6.
Fig. 6.
Simplified schematic models of MEcPP mode(s) of action in potentiating the GSR. Schematic models of the MEcPP-mediated cellular responses before (Upper) and after (Lower) stress. Possible MEcPP signaling routes are depicted, including stress-mediated alteration in MEcPP levels functioning as a rheostat for the release of Ca2+ for the activation of CAMTA3; MEcPP-mediated alteration of chromatin architecture enabling the accessibility of RSRE for transcriptional regulators; MEcPP potentially functioning as an allosteric modulator of CAMTA3 or its potential coinducer; or a yet unknown transcriptional activator (factor X) binding to and activating RSRE, ultimately triggering the GSR.

Similar articles

Cited by

References

    1. Gasch AP, et al. Genomic expression programs in the response of yeast cells to environmental changes. Mol Biol Cell. 2000;11(12):4241–4257. - PMC - PubMed
    1. Kültz D. Molecular and evolutionary basis of the cellular stress response. Annu Rev Physiol. 2005;67:225–257. - PubMed
    1. Ma S, Bohnert HJ. Integration of Arabidopsis thaliana stress-related transcript profiles, promoter structures, and cell-specific expression. Genome Biol. 2007;8(4):R49. - PMC - PubMed
    1. Walley JW, et al. Mechanical stress induces biotic and abiotic stress responses via a novel cis-element. PLoS Genet. 2007;3(10):1800–1812. - PMC - PubMed
    1. Weber H, Polen T, Heuveling J, Wendisch VF, Hengge R. Genome-wide analysis of the general stress response network in Escherichia coli: SigmaS-dependent genes, promoters, and sigma factor selectivity. J Bacteriol. 2005;187(5):1591–1603. - PMC - PubMed

Publication types

MeSH terms