. 2016 Aug;148(2):133-45.
doi: 10.1085/jgp.201611614. Epub 2016 Jul 18.

Biophysical characterization of the honeybee DSC1 orthologue reveals a novel voltage-dependent Ca2+ channel subfamily: CaV4

Affiliations

Biophysical characterization of the honeybee DSC1 orthologue reveals a novel voltage-dependent Ca2+ channel subfamily: CaV4

Pascal Gosselin-Badaroudine et al. J Gen Physiol. 2016 Aug.

Abstract

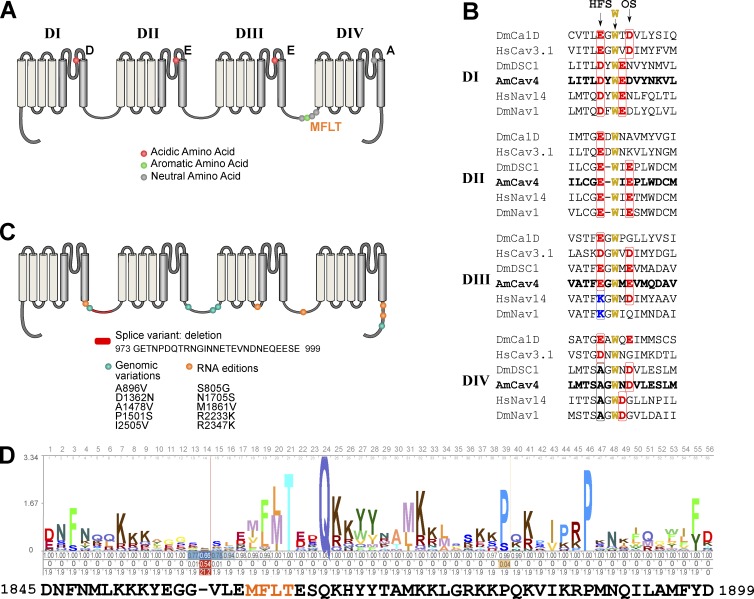
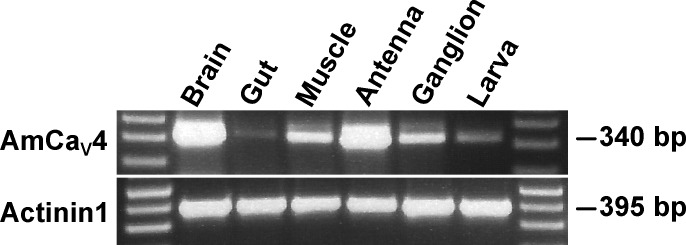
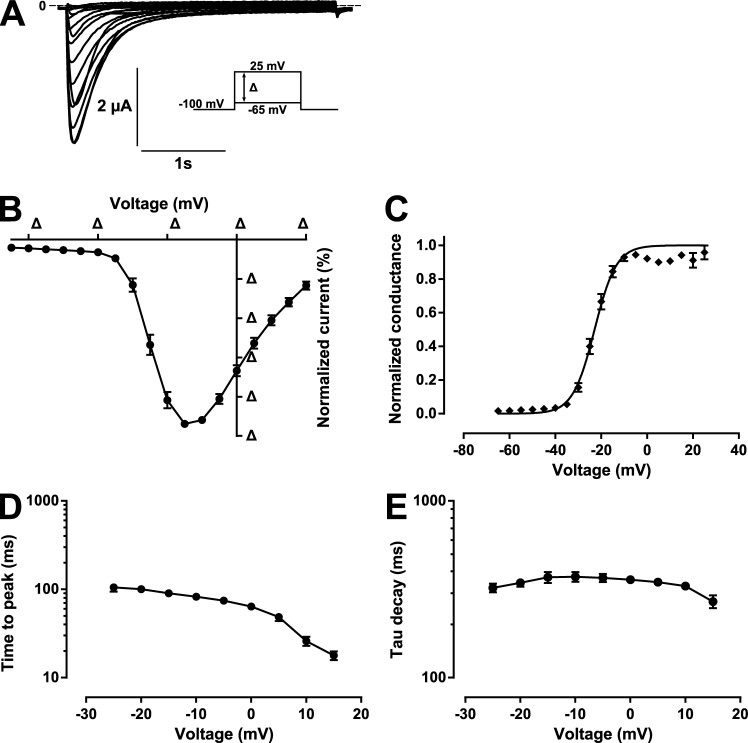
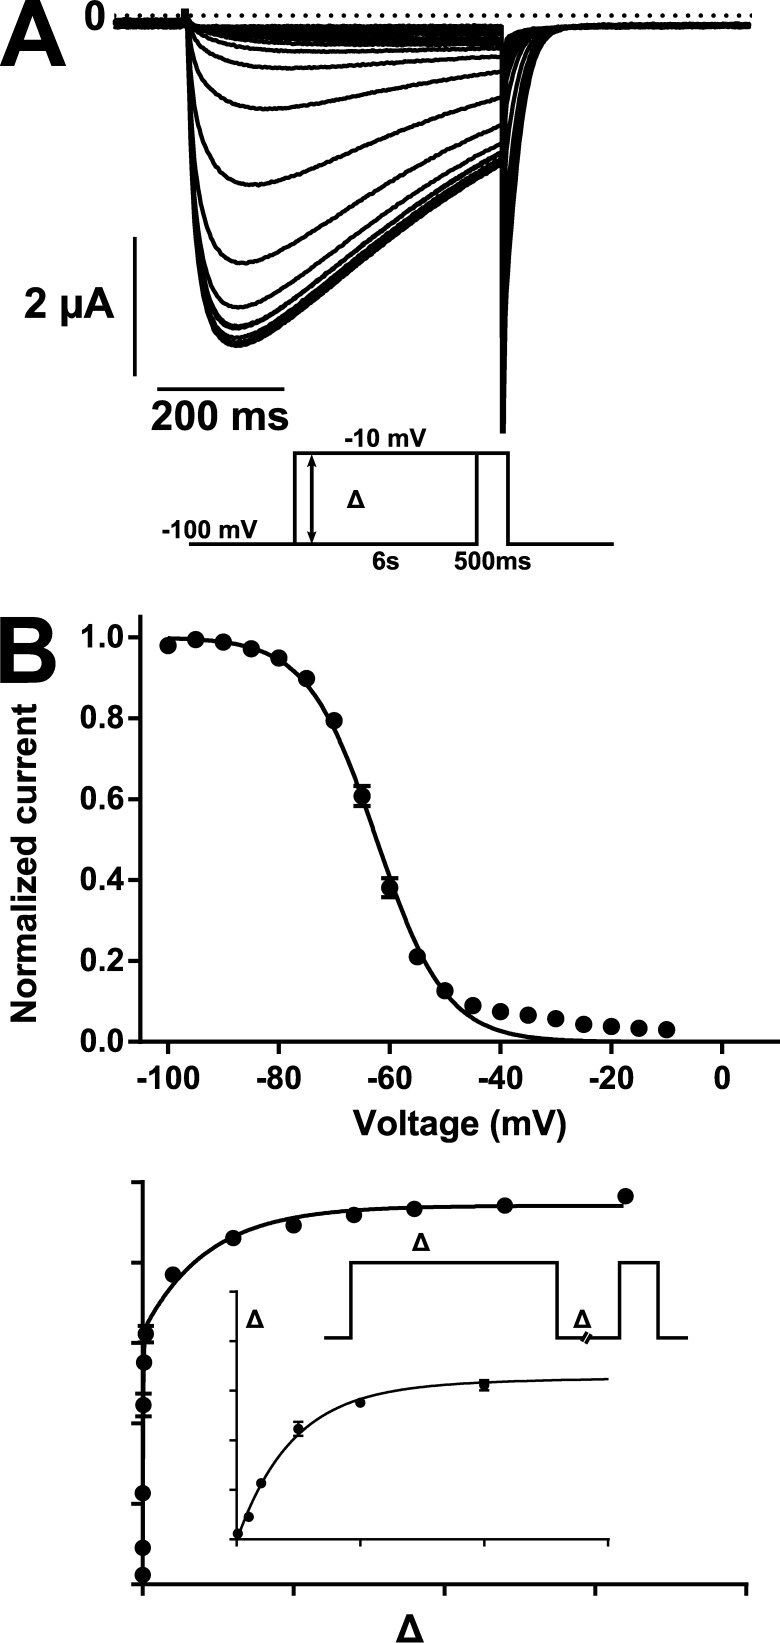
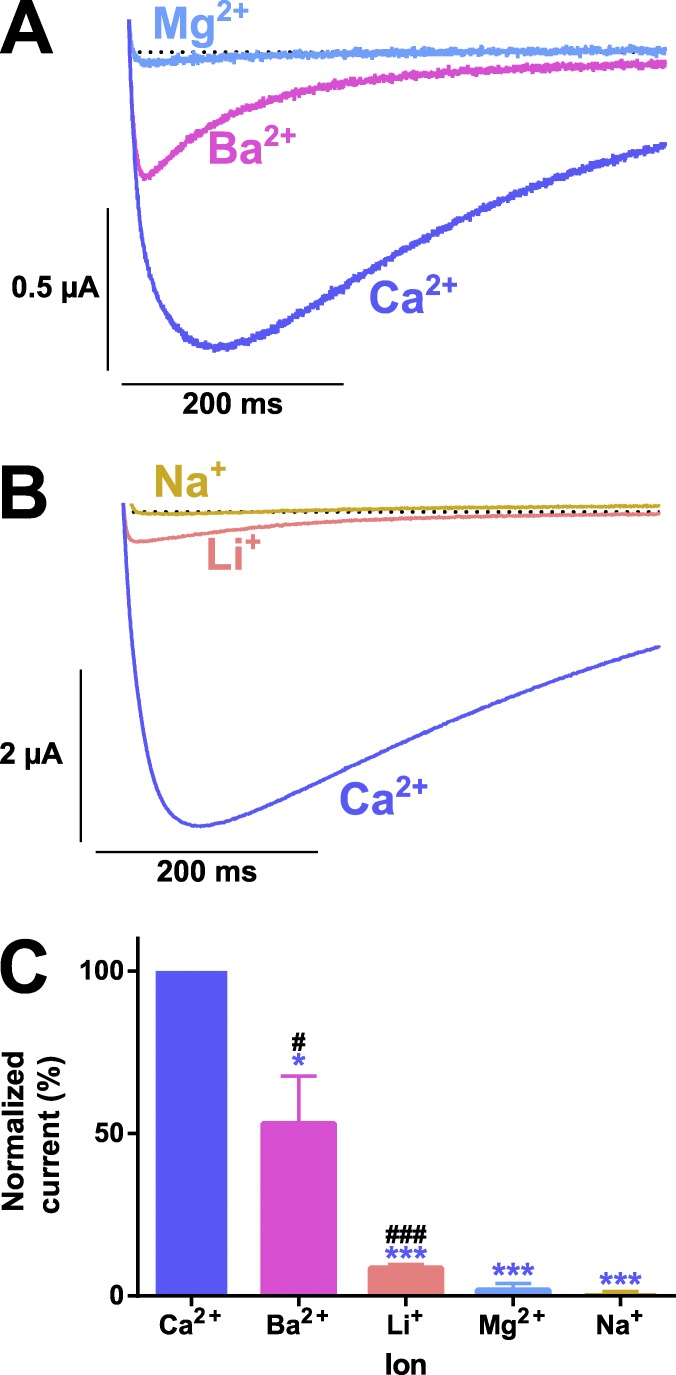
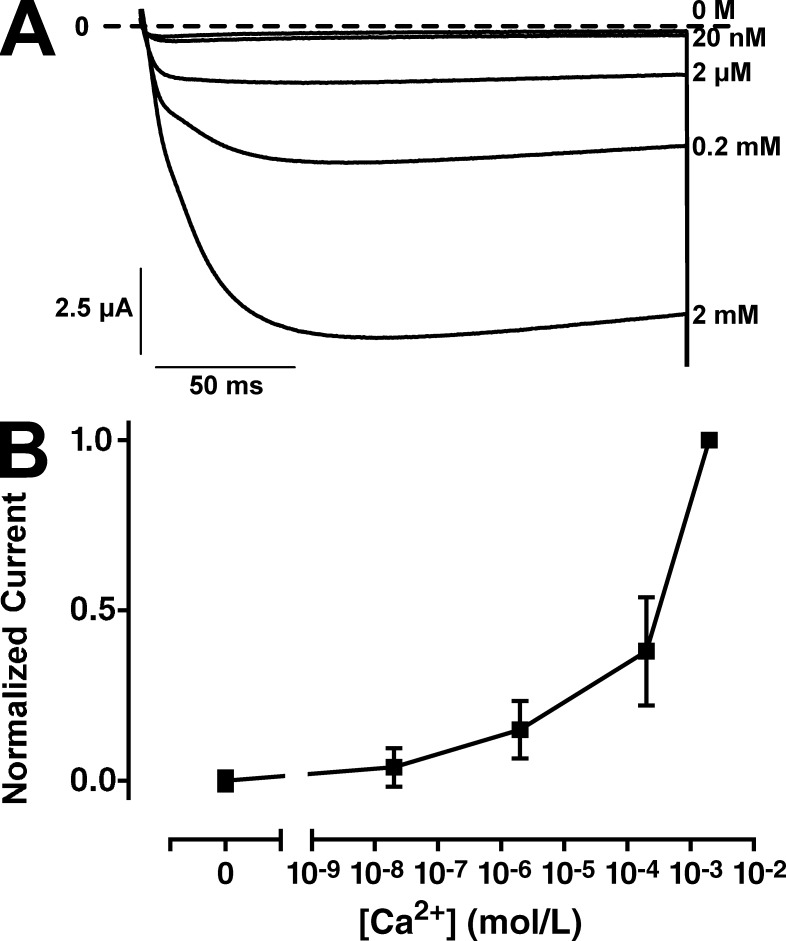
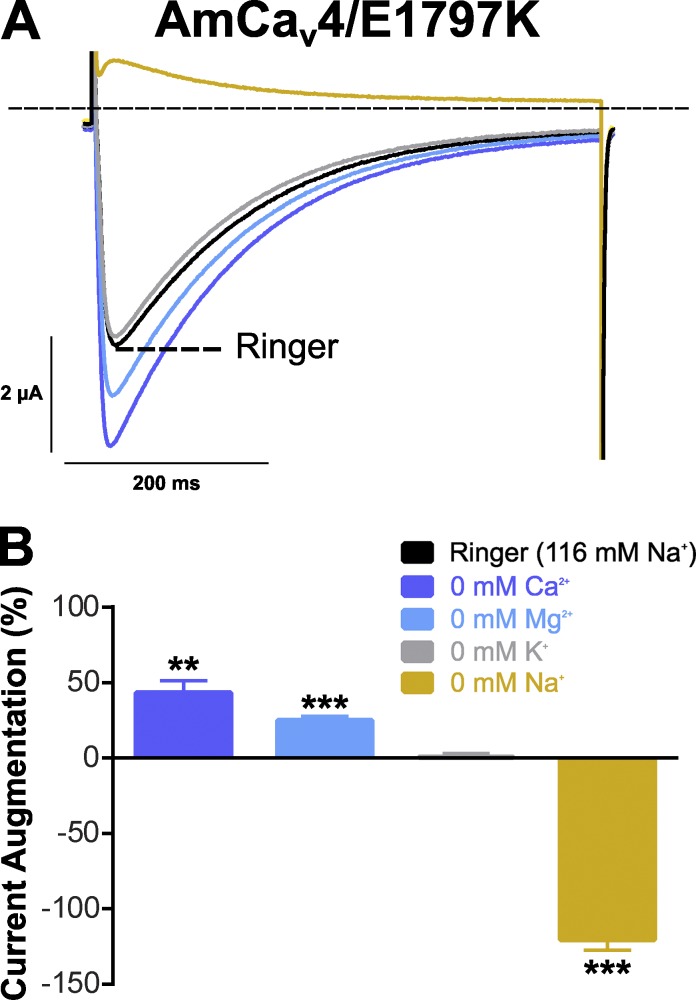
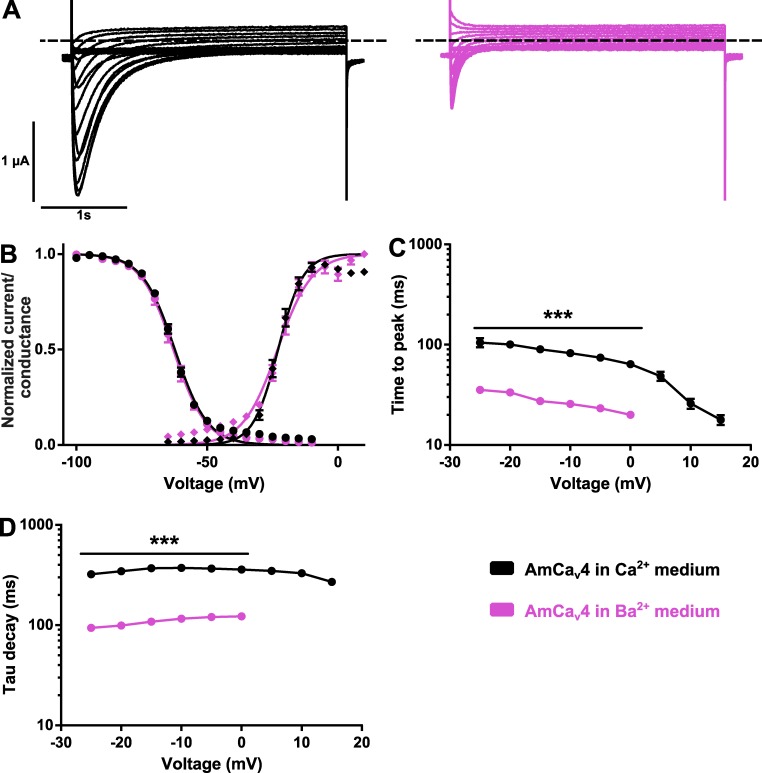
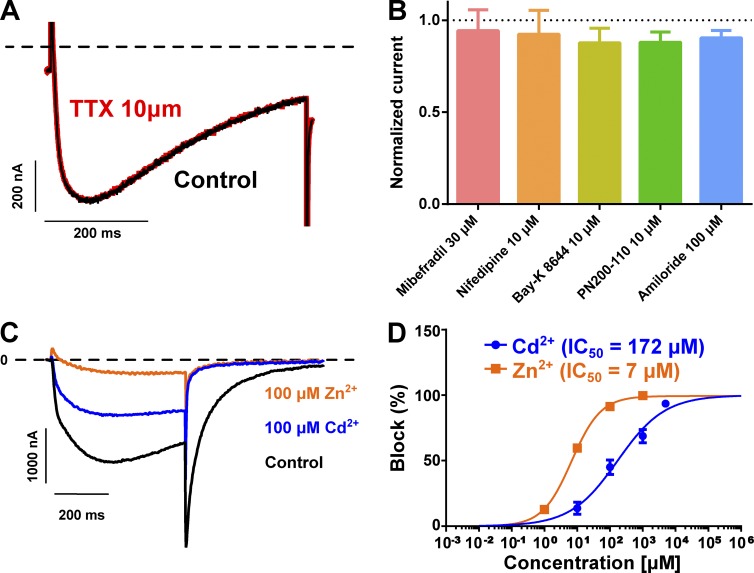
Bilaterian voltage-gated Na(+) channels (NaV) evolved from voltage-gated Ca(2+) channels (CaV). The Drosophila melanogaster Na(+) channel 1 (DSC1), which features a D-E-E-A selectivity filter sequence that is intermediate between CaV and NaV channels, is evidence of this evolution. Phylogenetic analysis has classified DSC1 as a Ca(2+)-permeable Na(+) channel belonging to the NaV2 family because of its sequence similarity with NaV channels. This is despite insect NaV2 channels (DSC1 and its orthologue in Blatella germanica, BSC1) being more permeable to Ca(2+) than Na(+) In this study, we report the cloning and molecular characterization of the honeybee (Apis mellifera) DSC1 orthologue. We reveal several sequence variations caused by alternative splicing, RNA editing, and genomic variations. Using the Xenopus oocyte heterologous expression system and the two-microelectrode voltage-clamp technique, we find that the channel exhibits slow activation and inactivation kinetics, insensitivity to tetrodotoxin, and block by Cd(2+) and Zn(2+) These characteristics are reminiscent of CaV channels. We also show a strong selectivity for Ca(2+) and Ba(2+) ions, marginal permeability to Li(+), and impermeability to Mg(2+) and Na(+) ions. Based on current ion channel nomenclature, the D-E-E-A selectivity filter, and the properties we have uncovered, we propose that DSC1 homologues should be classified as CaV4 rather than NaV2. Indeed, channels that contain the D-E-E-A selectivity sequence are likely to feature the same properties as the honeybee's channel, namely slow activation and inactivation kinetics and strong selectivity for Ca(2+) ions.


Figures

Figure 1.
Figure 1.
Sequence analysis of AmCaV4. (A) 2D representation of the motifs in the AmCaV4 channel, including the inactivation gate, the amino acid required for voltage-sensitive domains, and the selectivity filter. (B) Alignment of the sequences contributing to the selectivity of CaV and NaV channels. The primary selectivity sequence, also often named high field site (HFS), and the outer site of the selectivity filter (OS) is shown in bold. The highly conserved tryptophan and the residues of the outer selectivity filter (which contribute to TTX binding and pore selectivity) are also shown in bold. (C) Sequence variations for AmCaV4. (D) The HMM profile calculated based on the alignment of the 72 sequences available in the National Center for Biotechnology Information’s conserved domain database for the inactivation gate of the voltage-gated sodium channel α subunits domain (cd13433) compared with the sequence identified in our AmCaV4 amino acid sequence using hmmscan.
Figure 2.
Figure 2.
Tissue expression of CaV4 in the honeybee. The tissue-specific expression of AmCaV4 was assessed by RT-PCR. All the honeybee tissue samples were processed using the same preparation steps, from dissection to gel electrophoresis. The expected weights of the amplicons are given in base pairs. Actinin1 was used as a positive control.
Figure 3.
Figure 3.
Kinetics of the Ca2+ currents generated by AmCaV4 in response to depolarizing pulses. (A) Representative current traces from the pulse protocols applied to oocytes expressing AmCaV4. The pulse protocols consisted of imposing –65 mV to 25 mV voltage steps in 5-mV increments. The oocytes were kept at the holding potential (−100 mV) for 30 s between the voltage steps. (B) Normalized current–voltage (I-V) curve recorded in response to the protocol described in A. The curve recorded for each oocyte was normalized to its own peak current (n = 24). (C) The conductance–voltage curve calculated from the I-V curve in B fits a Boltzmann equation with the following parameters: V1/2 = −22 ± 1 mV and k = −4.5 ± 0.7 mV. The peak current measured at each potential for each oocyte was divided by (V − Vrev), where V is the test potential and Vrev is the reversal potential of the oocyte. (D) Time in milliseconds between the start of the stimulation and the peak current recorded for each test pulse. (E) Time constants of current decay. The protocol in A was used to generate transient sodium currents at different voltages. The decay of the transient current was fitted with a single exponential. The time constant of the fitted function was plotted as a function of the voltage imposed. Data are expressed as means ± SEM.
Figure 4.
Figure 4.
Voltage dependence of the inactivation and recovery from inactivation of AmCaV4. (A) Representative current trace recorded in response to the test pulse of the inactivation protocol given in the inset. (B, top) Voltage dependence of inactivation recorded from plotting the peak current measured with the test pulse as a function of the voltage imposed with the conditioning pulse. The current was normalized to the maximum peak current measured for each oocyte (n = 12). The voltage dependence of the inactivation of AmCaV4 fits a Boltzmann equation with the following parameters: V1/2 = −62.3 ± 0.6 mV and k = 6.2 ± 0.2 mV. The relatively poor fit between −40 and −20 mV was caused by a leak recorded in the absence of transient current was not subtracted. (Bottom) Kinetics of the recovery from inactivation of AmCaV4. The peak current measured with the test pulse normalized to the peak current measured with the conditioning pulse was plotted as a function of the time between the pulses. The data points were fitted to a two-exponential function with the following parameters: relative weight of the fast exponential = 67 ± 2%, time constant of the fast exponential = 50 ± 5 ms, and time constant of the slow exponential = 4.7 ± 00.5 s. Data are expressed as means ± SEM.
Figure 5.
Figure 5.
Ionic selectivity of the wild-type AmCaV4 channel. (A) Representative current traces recorded in response to a −10-mV test pulse in extracellular solutions containing divalent ions. (B) Representative current traces recorded in response to a −10 mV test pulse in the extracellular solutions containing monovalent ions. (C) The relative permeability of the ions was calculated by dividing the peak current in a given solution by the peak current in the Ca2+ solution (n = 3). The asterisks designate values that were deemed statistically different from the relative permeation of Ca2+ determined using a one-way ANOVA (*, P < 0.05; ***, P < 0.001). The number signs designate means that were deemed statistically different from 0 (no measurable current) determined using a t test (#, P < 0.05; ###, P < 0.001). All oocytes included in these series of experiments were injected with 50 nl EGTA chelating solution prior recordings. Error bars represent SEM.
Figure 6.
Figure 6.
The AmCaV4 channel does not display the anomalous mole fraction effect. (A) Representative current traces recorded with oocytes expressing AmCaV4 in solutions with varying concentrations of free Ca2+. (B) Normalized peak current recorded as a function of free Ca2+ in the extracellular solution. For each measurement, the peak current in a given solution was divided by the peak current measured in the 2 mM Ca2+ (n = 8–10). All solutions contained 100 mM Na+. The free Ca2+ in each solution was calculated using the MaxChelator program. The composition of the solutions is available in Table S3. Error bars represent SEM.
Figure 7.
Figure 7.
Ionic selectivity of the mutated AmCaV4/E1797K channel (DEKA selectivity filter). (A) Representative current traces recorded with oocytes expressing AmCaV4/E1797K in Ringer’s and modified Ringer’s solutions. (B) Mean change in the normalized peak current after removal of a permeable ion. For each oocyte, the peak current in a given solution was divided by the peak current measured in the Ringer’s solution and subtracted by 100% (n = 5). Data are expressed as means ± SEM. Statistical differences with peak currents measured in Ringer’s solution are identified with asterisks (**, P < 0.01; ***, P < 0.001). Outward currents were measured in the absence of sodium, whereas inward currents were measured in Ringer’s solution.
Figure 8.
Figure 8.
AmCaV4 kinetics are modified in the Ba2+ solution. (A) Representative current traces recorded with oocytes expressing AmCaV4 in the Ca2+ (left) and Ba2+ (right) solutions in response to the activation protocol. (B) Voltage dependence of the activation and inactivation of AmCaV4 in the Ca2+ and Ba2+ solutions (n = 7–24 for activation, n = 7–12 for inactivation). All voltage dependence experiments were fitted with Boltzmann equations. The parameters of the fits are given in Tables S1 and S2. (C) The time to peak was significantly accelerated in the barium solution. No measurements are available for voltage steps from 5 to 15 mV because of the small current amplitudes. (D) The current decay was significantly accelerated in the barium solution. Data are expressed as means ± SEM. All oocytes included in these series of experiments were injected with 50 nl EGTA chelating solution before recordings. ***, P < 0.001.
Figure 9.
Figure 9.
AmCaV4 single-channel conductance. (A) Single-channel traces from the cell-attached oocyte patch are illustrated for −20 and −40 mV. The arrow indicatea the onset of patch depolarization from less than −100 mV to the indicated voltage for 1 s. (B) All-points histogram of the single-channel current amplitudes at −40 mV. The smooth curve is a Gaussian fit with amplitude peaks at 0.77 pA. (C) Plot of the current–voltage relationship (n = 10–16). The straight line is a linear regression yielding a single-channel conductance of 10.42 ± 0.09 pS. Data are presented as mean ± SEM.
Figure 10.
Figure 10.
Pharmacology of AmCaV4. (A) Representative current traces recorded with an oocyte expressing AmCaV4 in response to a shortened activation protocol. AmCaV4 current was not inhibited by 10 µM TTX. (B) Known blockers and agonists of CaV channels had no effect on AmCaV4. (C) Representative current traces recorded with an oocyte expressing AmCaV4 in response to a shortened activation protocol in the Ca2+ solution. After recording the original current level, the oocyte chamber was perfused with the Ca2+ solution supplemented with 100 µM cadmium and then with the Ca2+ solution supplemented with 100 µM zinc. (D) Average block of AmCaV4 after the addition of different concentrations of cadmium and zinc to the extracellular solution (n = 3). The cumulative dose–response experiments were conducted separately for cadmium and zinc. Data are expressed as means ± SEM.

Comment in

  • What makes a sodium channel?
    Liebeskind BJ. Liebeskind BJ. J Gen Physiol. 2016 Aug;148(2):89-90. doi: 10.1085/jgp.201611652. Epub 2016 Jul 18. J Gen Physiol. 2016. PMID: 27432997 Free PMC article. No abstract available.

Similar articles

Cited by

References

    1. Budde T., Meuth S., and Pape H.-C.. 2002. Calcium-dependent inactivation of neuronal calcium channels. Nat. Rev. Neurosci. 3:873–883. 10.1038/nrn959 - DOI - PubMed
    1. Büsselberg D., Pekel M., Michael D., and Platt B.. 1994. Mercury (Hg2+) and zinc (Zn2+): two divalent cations with different actions on voltage-activated calcium channel currents. Cell. Mol. Neurobiol. 14:675–687. 10.1007/BF02088676 - DOI - PMC - PubMed
    1. Capella-Gutiérrez S., Silla-Martínez J.M., and Gabaldón T.. 2009. trimAl: a tool for automated alignment trimming in large-scale phylogenetic analyses. Bioinformatics. 25:1972–1973. 10.1093/bioinformatics/btp348 - DOI - PMC - PubMed
    1. Carbonneau E., Vijayaragavan K., and Chahine M.. 2002. A tryptophan residue (W736) in the amino-terminus of the P-segment of domain II is involved in pore formation in Na(v)1.4 voltage-gated sodium channels. Pflugers Arch. 445:18–24. 10.1007/s00424-002-0887-9 - DOI - PubMed
    1. Catterall W.A., Goldin A.L., and Waxman S.G.. 2005a International Union of Pharmacology. XLVII. Nomenclature and structure-function relationships of voltage-gated sodium channels. Pharmacol. Rev. 57:397–409. 10.1124/pr.57.4.4 - DOI - PubMed

Publication types

Substances