

Fasiglifam (TAK-875) has dual potentiating mechanisms via Gαq-GPR40/FFAR1 signaling branches on glucose-dependent insulin secretion
- PMID: 27433346
- PMCID: PMC4876146
- DOI: 10.1002/prp2.237
Fasiglifam (TAK-875) has dual potentiating mechanisms via Gαq-GPR40/FFAR1 signaling branches on glucose-dependent insulin secretion
Abstract
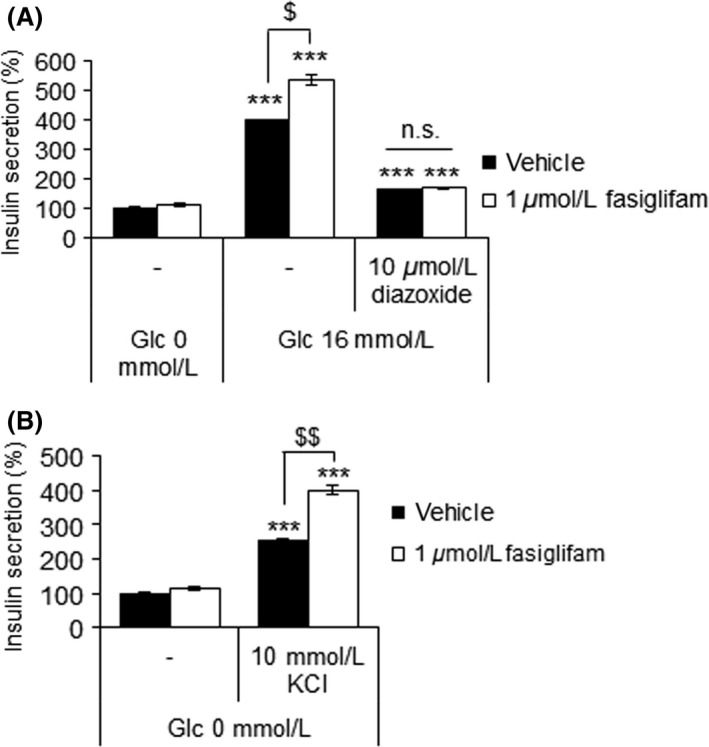
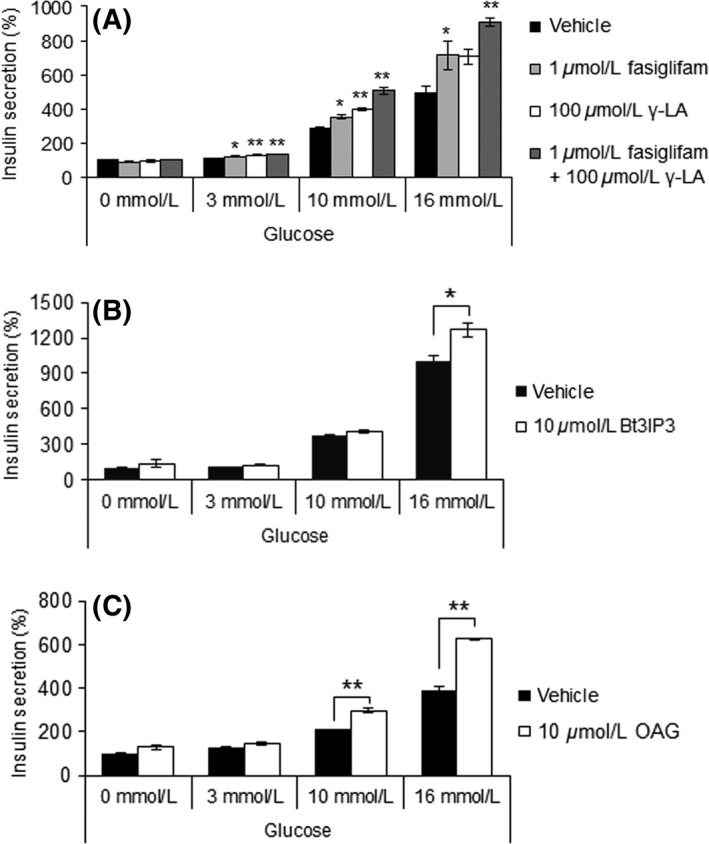
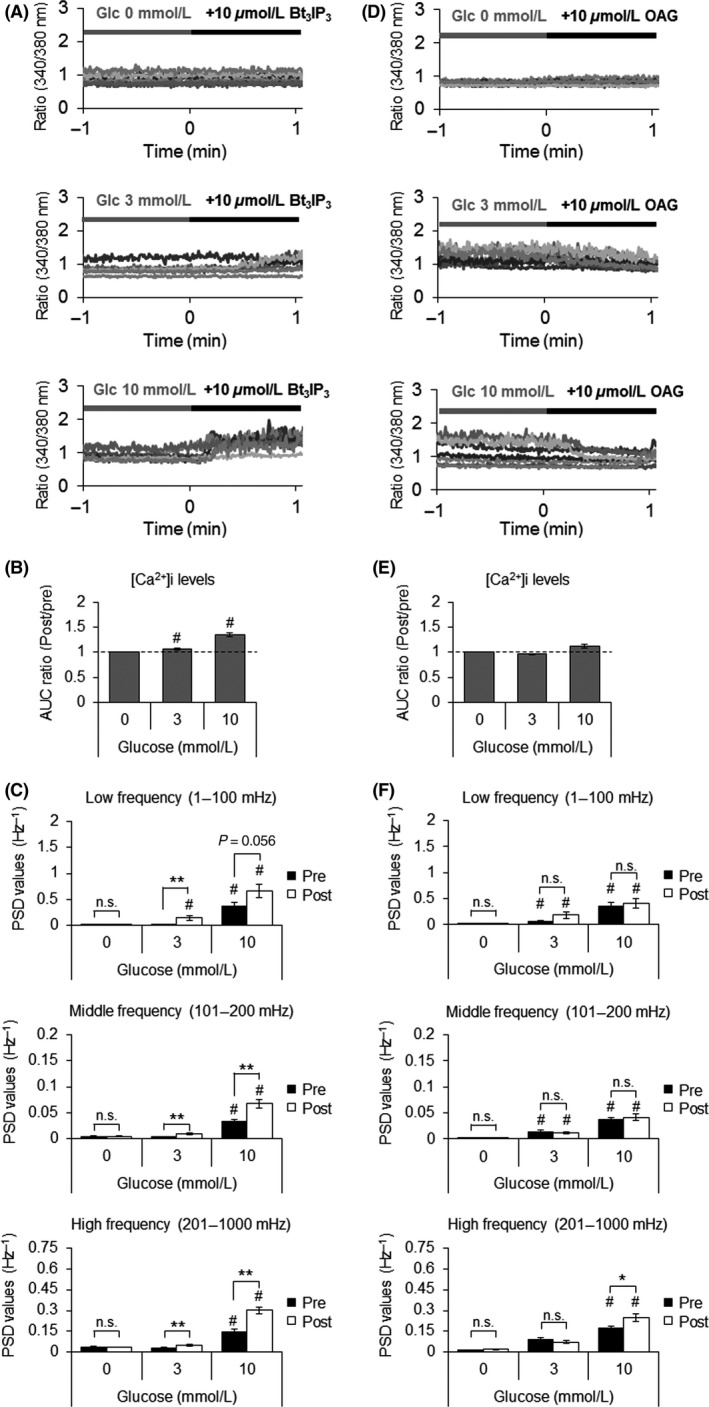
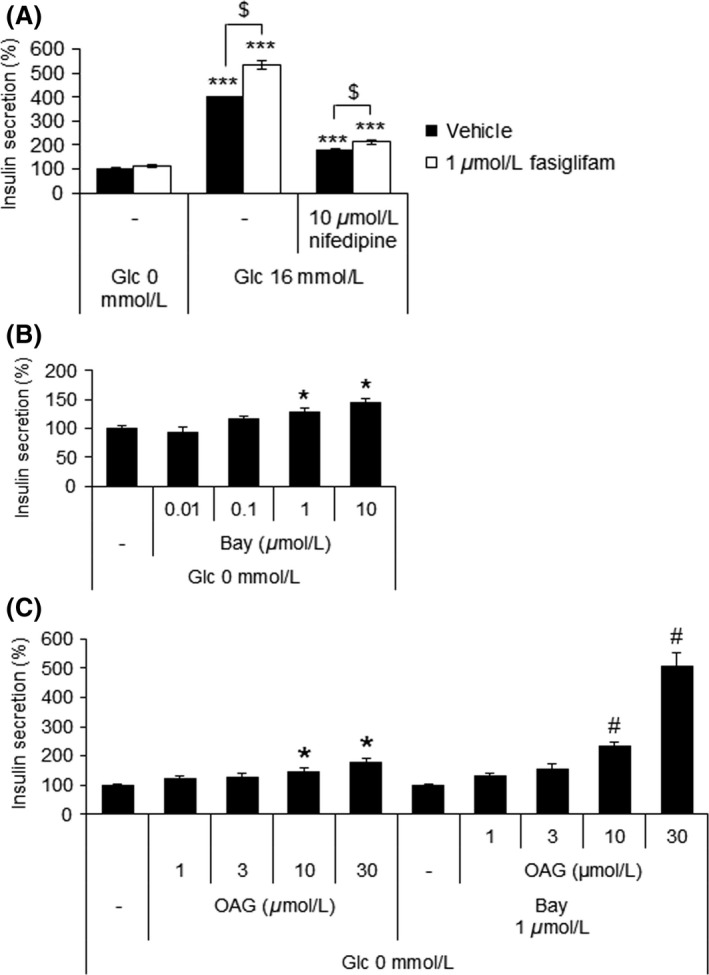
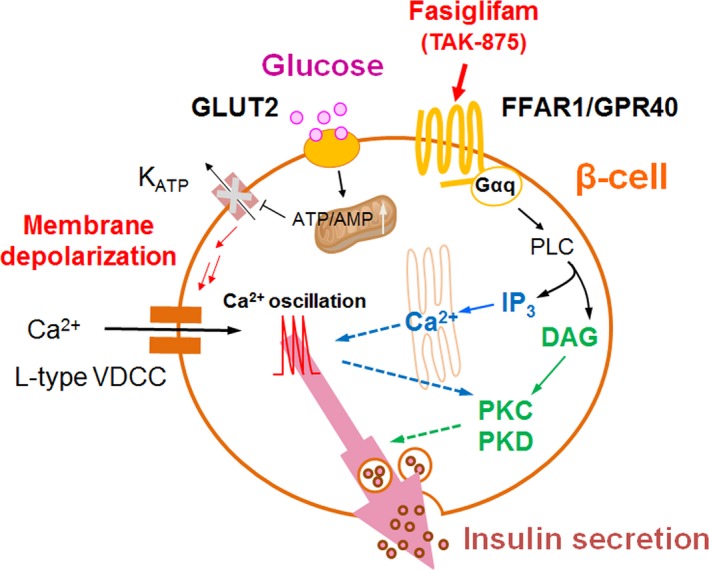
Fasiglifam (TAK-875) is a free fatty acid receptor 1 (FFAR1)/G-protein-coupled receptor 40 (GPR40) agonist that improves glycemic control in type 2 diabetes with minimum risk of hypoglycemia. Fasiglifam potentiates glucose-stimulated insulin secretion (GSIS) from pancreatic β-cells glucose dependently, although the precise mechanism underlying the glucose dependency still remains unknown. Here, we investigated key cross-talk between the GSIS pathway and FFAR1 signaling, and Ca(2+) dynamics using mouse insulinoma MIN6 cells. We demonstrated that the glucose-dependent insulinotropic effect of fasiglifam required membrane depolarization and that fasiglifam induced a glucose-dependent increase in intracellular Ca(2+) level and amplification of Ca(2+) oscillations. This differed from the sulfonylurea glimepiride that induced changes in Ca(2+) dynamics glucose independently. Stimulation with cell-permeable analogs of IP3 or diacylglycerol (DAG), downstream second messengers of Gαq-FFAR1, augmented GSIS similar to fasiglifam, indicating their individual roles in the potentiation of GSIS pathway. Intriguingly, the IP3 analog triggered similar Ca(2+) dynamics to fasiglifam, whereas the DAG analog had no effect. Despite the lack of an effect on Ca(2+) dynamics, the DAG analog elicited synergistic effects on insulin secretion with Ca(2+) influx evoked by an L-type voltage-dependent calcium channel opener that mimics glucose-dependent Ca(2+) dynamics. These results indicate that the Gαq signaling activated by fasiglifam enhances GSIS pathway via dual potentiating mechanisms in which IP3 amplifies glucose-induced Ca(2+) oscillations and DAG/protein kinase C (PKC) augments downstream secretory mechanisms independent of Ca(2+) oscillations.
Keywords: Ca2+ oscillation; FFAR1/GPR40; fasiglifam (TAK‐875); glucose‐stimulated insulin secretion (GSIS); type 2 diabetes mellitus (T2DM).
Figures

Similar articles
-
A novel antidiabetic drug, fasiglifam/TAK-875, acts as an ago-allosteric modulator of FFAR1.PLoS One. 2013 Oct 10;8(10):e76280. doi: 10.1371/journal.pone.0076280. eCollection 2013. PLoS One. 2013. PMID: 24130766 Free PMC article.
-
Potentiation of Glucose-stimulated Insulin Secretion by the GPR40-PLC-TRPC Pathway in Pancreatic β-Cells.Sci Rep. 2016 May 16;6:25912. doi: 10.1038/srep25912. Sci Rep. 2016. PMID: 27180622 Free PMC article.
-
CPL207280, a Novel G Protein-Coupled Receptor 40/Free Fatty Acid Receptor 1-Specific Agonist, Shows a Favorable Safety Profile and Exerts Antidiabetic Effects in Type 2 Diabetic Animals.Mol Pharmacol. 2021 Oct;100(4):335-347. doi: 10.1124/molpharm.121.000260. Epub 2021 Aug 4. Mol Pharmacol. 2021. PMID: 34349026
-
[Regulation of Lipid Metabolism by Diacylglycerol Kinases in Pancreatic β-cells].Yakugaku Zasshi. 2016;136(3):461-5. doi: 10.1248/yakushi.15-00246-1. Yakugaku Zasshi. 2016. PMID: 26935087 Review. Japanese.
-
Fasiglifam as a new potential treatment option for patients with type 2 diabetes.Expert Opin Pharmacother. 2013 Dec;14(18):2591-600. doi: 10.1517/14656566.2013.851668. Epub 2013 Nov 6. Expert Opin Pharmacother. 2013. PMID: 24195772 Review.
Cited by
-
Effects of Dietary Fatty Acids in Pancreatic Beta Cell Metabolism, Implications in Homeostasis.Nutrients. 2018 Mar 22;10(4):393. doi: 10.3390/nu10040393. Nutrients. 2018. PMID: 29565831 Free PMC article. Review.
-
Formation of βTC3 and MIN6 Pseudoislets Changes the Expression Pattern of Gpr40, Gpr55, and Gpr119 Receptors and Improves Lysophosphatidylcholines-Potentiated Glucose-Stimulated Insulin Secretion.Cells. 2020 Sep 9;9(9):2062. doi: 10.3390/cells9092062. Cells. 2020. PMID: 32917053 Free PMC article.
-
G-protein-coupled receptor 40 agonist GW9508 potentiates glucose-stimulated insulin secretion through activation of protein kinase Cα and ε in INS-1 cells.PLoS One. 2019 Sep 9;14(9):e0222179. doi: 10.1371/journal.pone.0222179. eCollection 2019. PLoS One. 2019. PMID: 31498851 Free PMC article.
-
Lipid-Induced Adaptations of the Pancreatic Beta-Cell to Glucotoxic Conditions Sustain Insulin Secretion.Int J Mol Sci. 2021 Dec 28;23(1):324. doi: 10.3390/ijms23010324. Int J Mol Sci. 2021. PMID: 35008750 Free PMC article. Review.
-
Mechanisms of the amplifying pathway of insulin secretion in the β cell.Pharmacol Ther. 2017 Nov;179:17-30. doi: 10.1016/j.pharmthera.2017.05.003. Epub 2017 May 18. Pharmacol Ther. 2017. PMID: 28527919 Free PMC article. Review.
References
-
- American Diabetes Association (2015). Standards of medical care in diabetes–2015: 7. Approaches to Glycemic Treatment. Diabetes care 38(Suppl. 1): S41–48. - PubMed
-
- Berggren PO, Yang SN, Murakami M, Efanov AM, Uhles S, Kohler M, et al. (2004). Removal of Ca2+ channel beta3 subunit enhances Ca2+ oscillation frequency and insulin exocytosis. Cell 119: 273–284. - PubMed
-
- Bergsten P (1995). Slow and fast oscillations of cytoplasmic Ca2+ in pancreatic islets correspond to pulsatile insulin release. Am J Physiol 268: E282–E287. - PubMed
-
- Bergsten P (2002). Role of oscillations in membrane potential, cytoplasmic Ca2+, and metabolism for plasma insulin oscillations. Diabetes 51(Suppl 1): S171–S176. - PubMed
LinkOut - more resources
Full Text Sources
Other Literature Sources
Miscellaneous
