. 2016:2016:7285132.
doi: 10.1155/2016/7285132. Epub 2016 Jun 28.

Static and Dynamic Measurement of Ocular Surface Temperature in Dry Eyes

Affiliations

Static and Dynamic Measurement of Ocular Surface Temperature in Dry Eyes

Li Li Tan et al. J Ophthalmol. 2016.

Abstract

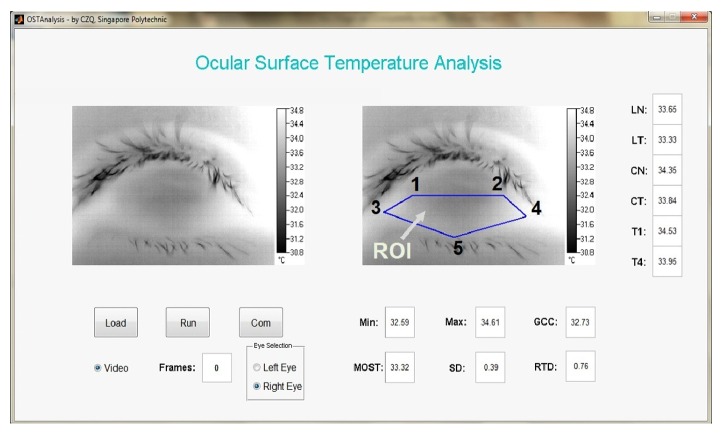
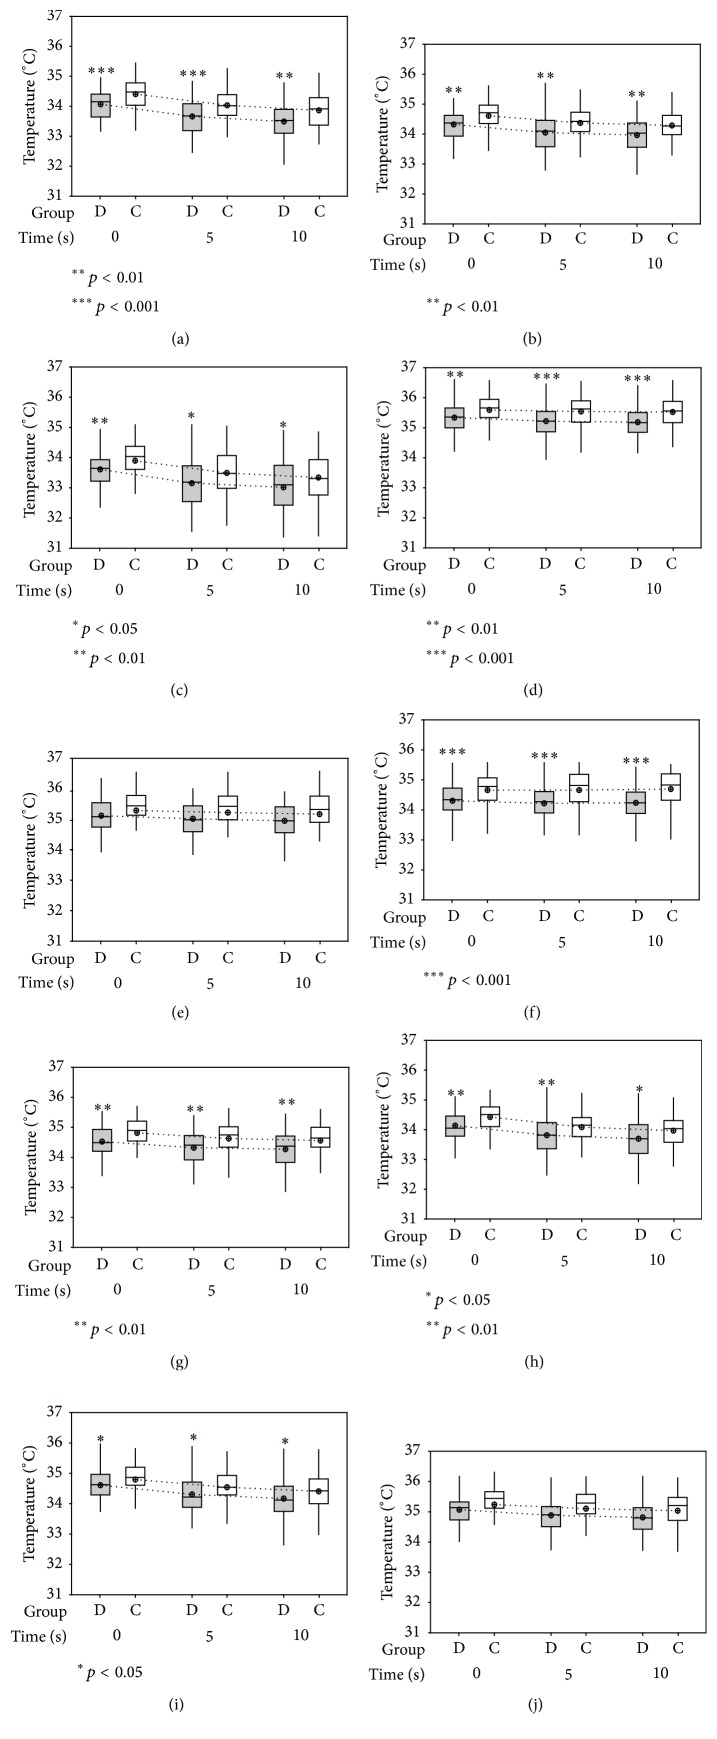
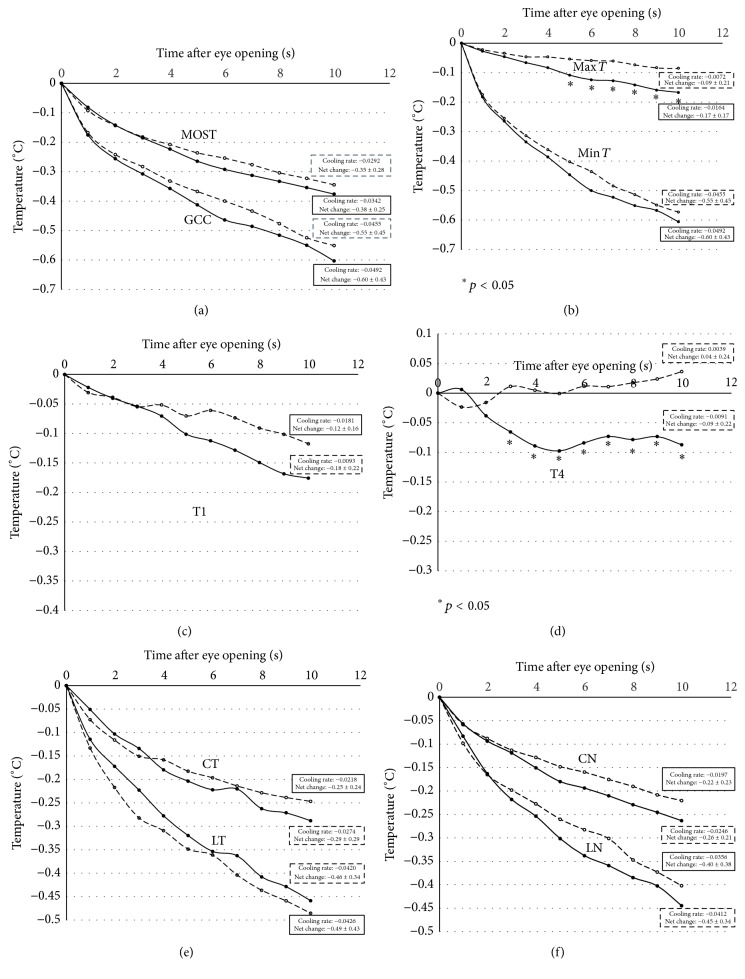
Purpose. To study ocular surface temperature (OST) in dry eyes by static and dynamic measures. Methods. OST was recorded on 62 dry eyes and 63 age- and sex-matched controls. Static measures were study of absolute OST at t = 0, 5, and 10 s after eye opening. Dynamic measures were study of mean change and net change in OST over 10 s of sustained eye opening. Ten OST indices studied were temperatures of the geometric center of the cornea (GCC), extreme temporal (T1) and nasal conjunctiva (T4), midtemporal (CT) and nasal conjunctiva (CN), temporal (LT) and nasal (LN) limbus, and mean (MOST), maximum (Max T), and minimum (Min T) temperatures of the region of interest. Results. For static measures, dry eyes recorded significantly lower GCC, MOST, Min T, Max T, T4, CT, LT, LN, and CN. For dynamic measures, dry eyes had significantly steeper regression line of mean change (corresponding to greater net change) for Max T 5 s onward and T4 at 3 s onward. Conclusions. Both static and dynamic measures of the OST were valuable and can be used as clinical tool to assess dry eye.


Figures

Figure 1
Figure 1
Ocular surface marking and OST acquisition using the novel “diamond” method.
Figure 2
Figure 2
(Static measures) box plots showing comparison of absolute OST at 0 s, 5 s, and 10 s: (a) GCC; (b) MOST; (c) Min T; (d) Max T; (e) T1; (f) T4; (g) CT; (h) LT; (i) LN; and (j) CN in (grey box) dry eye subjects and (white box) controls. The results were expressed as median and mean ± SD. Mean-connecting-lines are represented by dotted lines to show the change in mean over 0 s, 5 s, and 10 s. p values are shown using one-way ANOVA at 95% CI.
Figure 3
Figure 3
(Dynamic measures) graphs showing the mean change OST (relative to baseline) during the 10 s sustained eye opening: (a) GCC and MOST; (b) Min T and Max T; (c) T1; (d) T4; (e) CT and LT; (f) CN and LN in (solid circles) dry eye subjects and (open circles) controls. Values in boxes represent the cooling rate and net change in OST over the 10 s period in dry eye and control groups, respectively. A comparison of mean at each 1 s interval was performed using unpaired t-test, p < 0.05. A typical standard deviation for GCC was ±0.29 (= average std deviation) for dry eye and ±0.30 for controls and for MOST it was ±0.15 for dry eye and ±0.18 for controls. A typical standard deviation for Min T was ±0.33 for dry eye and ±0.32 for controls and for Max T it was ±0.11 for dry eye and ±0.13 for controls. A typical standard deviation for T1 was ±0.14 for dry eye and ±0.11 for controls and for T4 it was ±0.21 for dry eye and ±0.16 for controls. A typical standard deviation for CT was ±0.19 for dry eye and ±0.17 for controls and for LT it was ±0.23 for dry eye and ±0.29 for controls. A typical standard deviation for CN was ±0.14 for dry eye and ±0.16 for controls and for LN it was ±0.22 for dry eye and ±0.23 for controls.

Similar articles

Cited by

References

    1. Nichols K. K., Foulks G. N., Bron A. J., et al. The international workshop on meibomian gland dysfunction: executive summary. Investigative Ophthalmology and Visual Science. 2011;52(4):1922–1929. doi: 10.1167/iovs.10-6997a. - DOI - PMC - PubMed
    1. Lemp M. A., Baudouin C., Baum J., et al. The definition and classification of dry eye disease: report of the Definition and Classification Subcommittee of the International Dry Eye WorkShop (2007) Ocular Surface. 2007;5(2):75–92. doi: 10.1016/s1542-0124(12)70081-2. - DOI - PubMed
    1. Morgan P. B., Soh M. P., Efron N., Tullo A. B. Potential applications of ocular thermography. Optometry and Vision Science. 1993;70(7):568–576. doi: 10.1097/00006324-199307000-00008. - DOI - PubMed
    1. Mapstone R. Measurement of corneal temperature. Experimental Eye Research. 1968;7(2):237–243. doi: 10.1016/s0014-4835(68)80073-9. - DOI - PubMed
    1. Mapstone R. Corneal thermal patterns in anterior uveitis. British Journal of Ophthalmology. 1968;52(12):917–921. doi: 10.1136/bjo.52.12.917. - DOI - PMC - PubMed

LinkOut - more resources