

Neural encoding of the speech envelope by children with developmental dyslexia
- PMID: 27433986
- PMCID: PMC5108463
- DOI: 10.1016/j.bandl.2016.06.006
Neural encoding of the speech envelope by children with developmental dyslexia
Abstract
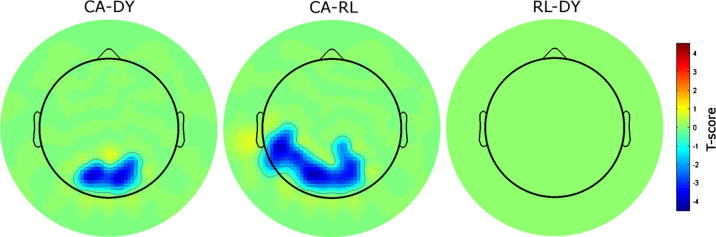
Developmental dyslexia is consistently associated with difficulties in processing phonology (linguistic sound structure) across languages. One view is that dyslexia is characterised by a cognitive impairment in the "phonological representation" of word forms, which arises long before the child presents with a reading problem. Here we investigate a possible neural basis for developmental phonological impairments. We assess the neural quality of speech encoding in children with dyslexia by measuring the accuracy of low-frequency speech envelope encoding using EEG. We tested children with dyslexia and chronological age-matched (CA) and reading-level matched (RL) younger children. Participants listened to semantically-unpredictable sentences in a word report task. The sentences were noise-vocoded to increase reliance on envelope cues. Envelope reconstruction for envelopes between 0 and 10Hz showed that the children with dyslexia had significantly poorer speech encoding in the 0-2Hz band compared to both CA and RL controls. These data suggest that impaired neural encoding of low frequency speech envelopes, related to speech prosody, may underpin the phonological deficit that causes dyslexia across languages.
Keywords: Dyslexia; Oscillations; Phonology; Rhythm.
Copyright © 2016 The Authors. Published by Elsevier Inc. All rights reserved.
Figures


Similar articles
-
Language-universal sensory deficits in developmental dyslexia: English, Spanish, and Chinese.J Cogn Neurosci. 2011 Feb;23(2):325-37. doi: 10.1162/jocn.2010.21453. Epub 2010 Feb 10. J Cogn Neurosci. 2011. PMID: 20146613
-
Difficulties in auditory organization as a cause of reading backwardness? An auditory neuroscience perspective.Dev Sci. 2017 Nov;20(6):e12457. doi: 10.1111/desc.12457. Epub 2016 Sep 22. Dev Sci. 2017. PMID: 27659413 Free PMC article.
-
Linguistic and non-linguistic prosodic skills in Spanish children with developmental dyslexia.Res Dev Disabil. 2019 Jul;90:92-100. doi: 10.1016/j.ridd.2019.04.013. Epub 2019 May 11. Res Dev Disabil. 2019. PMID: 31085452
-
Outstanding questions about phonological processing in dyslexia.Dyslexia. 2001 Oct-Dec;7(4):197-216. doi: 10.1002/dys.205. Dyslexia. 2001. PMID: 11881781 Review.
-
Neural Noise Hypothesis of Developmental Dyslexia.Trends Cogn Sci. 2017 Jun;21(6):434-448. doi: 10.1016/j.tics.2017.03.008. Epub 2017 Apr 8. Trends Cogn Sci. 2017. PMID: 28400089 Free PMC article. Review.
Cited by
-
Early language experience modulates the tradeoff between acoustic-temporal and lexico-semantic cortical tracking of speech.iScience. 2024 Jun 11;27(7):110247. doi: 10.1016/j.isci.2024.110247. eCollection 2024 Jul 19. iScience. 2024. PMID: 39006483 Free PMC article.
-
Validation of cost-efficient EEG experimental setup for neural tracking in an auditory attention task.Sci Rep. 2023 Dec 19;13(1):22682. doi: 10.1038/s41598-023-49990-6. Sci Rep. 2023. PMID: 38114579 Free PMC article.
-
Speech-Brain Frequency Entrainment of Dyslexia with and without Phonological Deficits.Brain Sci. 2020 Nov 28;10(12):920. doi: 10.3390/brainsci10120920. Brain Sci. 2020. PMID: 33260681 Free PMC article.
-
The temporal modulation structure of illiterate versus literate adult speech.PLoS One. 2018 Oct 24;13(10):e0205224. doi: 10.1371/journal.pone.0205224. eCollection 2018. PLoS One. 2018. PMID: 30356281 Free PMC article.
-
Beta oscillations predict the envelope sharpness in a rhythmic beat sequence.Sci Rep. 2025 Jan 28;15(1):3510. doi: 10.1038/s41598-025-86895-y. Sci Rep. 2025. PMID: 39875442 Free PMC article.
References
-
- Barkley R.A., Murphy K.R. Guilford Press; New York, NY: 1998. Attention-deficit hyperactivity disorder: A clinical workbook.
-
- Bialek W., Rieke F., Van Steveninck R.D.R., Warland D. Reading a neural code. Science. 1991;252:1854–1857. - PubMed
MeSH terms
Grants and funding
LinkOut - more resources
Full Text Sources
Other Literature Sources
