

Visualizing Metal Content and Intracellular Distribution in Primary Hippocampal Neurons with Synchrotron X-Ray Fluorescence
- PMID: 27434052
- PMCID: PMC4951041
- DOI: 10.1371/journal.pone.0159582
Visualizing Metal Content and Intracellular Distribution in Primary Hippocampal Neurons with Synchrotron X-Ray Fluorescence
Abstract
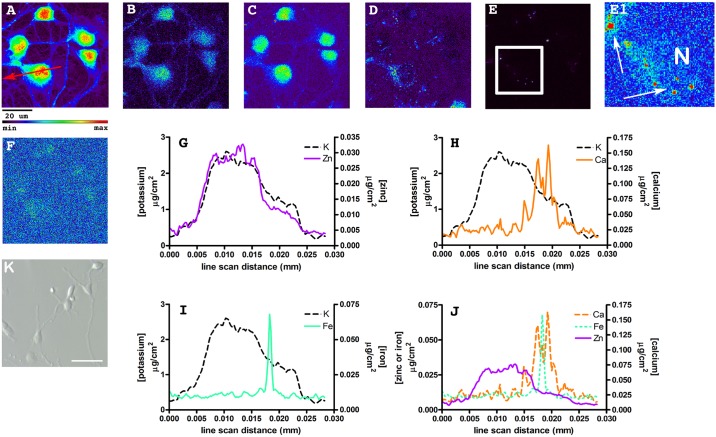
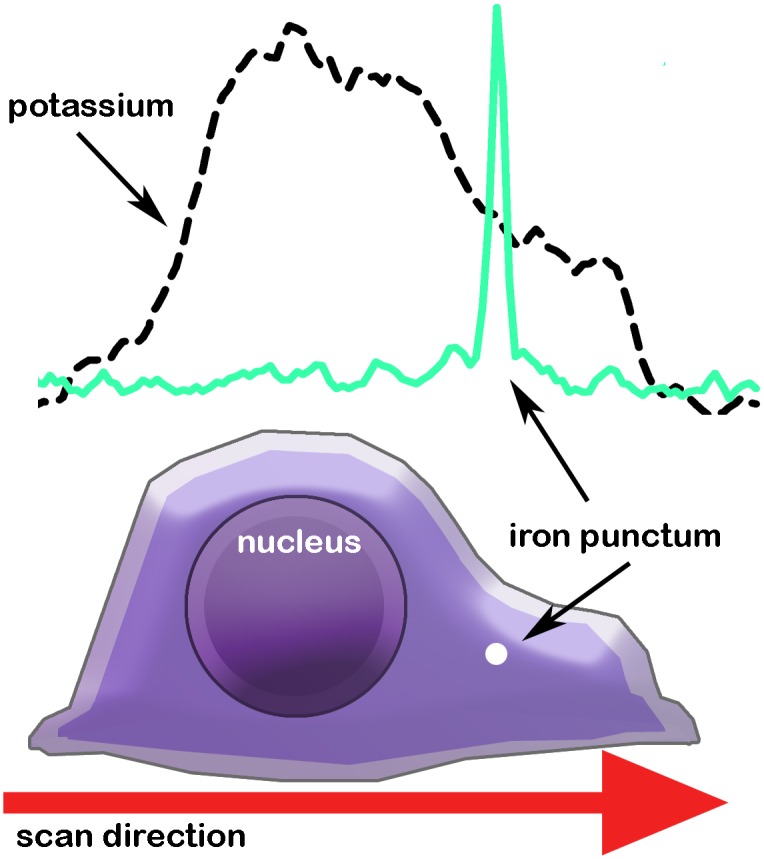
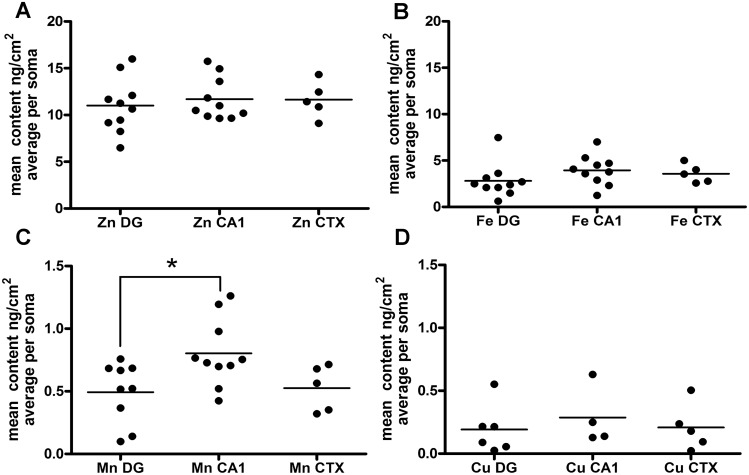
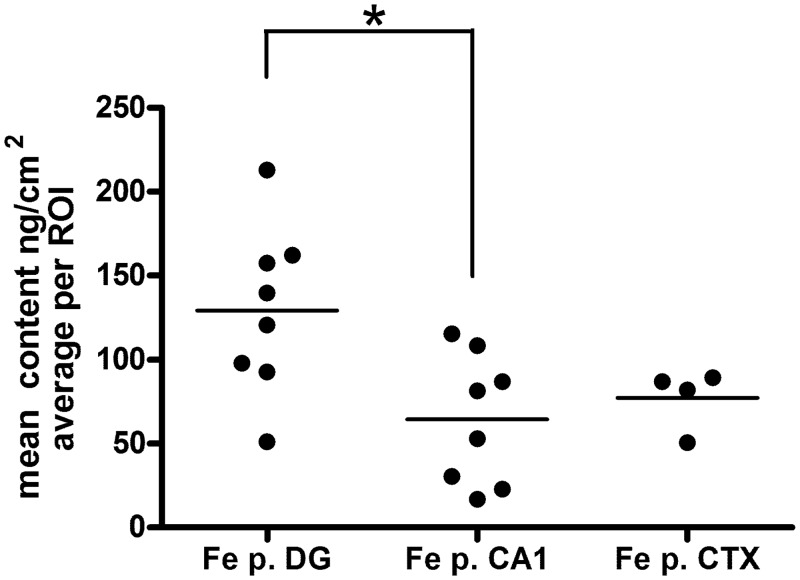
Increasing evidence suggests that metal dyshomeostasis plays an important role in human neurodegenerative diseases. Although distinctive metal distributions are described for mature hippocampus and cortex, much less is known about metal levels and intracellular distribution in individual hippocampal neuronal somata. To solve this problem, we conducted quantitative metal analyses utilizing synchrotron radiation X-Ray fluorescence on frozen hydrated primary cultured neurons derived from rat embryonic cortex (CTX) and two regions of the hippocampus: dentate gyrus (DG) and CA1. Comparing average metal contents showed that the most abundant metals were calcium, iron, and zinc, whereas metals such as copper and manganese were less than 10% of zinc. Average metal contents were generally similar when compared across neurons cultured from CTX, DG, and CA1, except for manganese that was larger in CA1. However, each metal showed a characteristic spatial distribution in individual neuronal somata. Zinc was uniformly distributed throughout the cytosol, with no evidence for the existence of previously identified zinc-enriched organelles, zincosomes. Calcium showed a peri-nuclear distribution consistent with accumulation in endoplasmic reticulum and/or mitochondria. Iron showed 2-3 distinct highly concentrated puncta only in peri-nuclear locations. Notwithstanding the small sample size, these analyses demonstrate that primary cultured neurons show characteristic metal signatures. The iron puncta probably represent iron-accumulating organelles, siderosomes. Thus, the metal distributions observed in mature brain structures are likely the result of both intrinsic neuronal factors that control cellular metal content and extrinsic factors related to the synaptic organization, function, and contacts formed and maintained in each region.
Conflict of interest statement
Figures
Similar articles
-
Understanding metal homeostasis in primary cultured neurons. Studies using single neuron subcellular and quantitative metallomics.Metallomics. 2015 Jul;7(7):1111-23. doi: 10.1039/c5mt00084j. Metallomics. 2015. PMID: 25894020
-
Iron, copper, and zinc distribution of the cerebellum.Cerebellum. 2009 Jun;8(2):74-9. doi: 10.1007/s12311-008-0091-3. Epub 2009 Jan 13. Cerebellum. 2009. PMID: 19139969
-
X-ray fluorescence imaging of the hippocampal formation after manganese exposure.Metallomics. 2013 Nov;5(11):1554-65. doi: 10.1039/c3mt00133d. Metallomics. 2013. PMID: 23999853 Free PMC article.
-
Cellular and Molecular Differences Between Area CA1 and the Dentate Gyrus of the Hippocampus.Mol Neurobiol. 2019 Sep;56(9):6566-6580. doi: 10.1007/s12035-019-1541-2. Epub 2019 Mar 14. Mol Neurobiol. 2019. PMID: 30874972 Review.
-
Blood-brain barrier flux of aluminum, manganese, iron and other metals suspected to contribute to metal-induced neurodegeneration.J Alzheimers Dis. 2006 Nov;10(2-3):223-53. doi: 10.3233/jad-2006-102-309. J Alzheimers Dis. 2006. PMID: 17119290 Review.
Cited by
-
Biogenesis of zinc storage granules in Drosophila melanogaster.J Exp Biol. 2018 Mar 19;221(Pt 6):jeb168419. doi: 10.1242/jeb.168419. J Exp Biol. 2018. PMID: 29367274 Free PMC article.
-
Analytical Methods for Imaging Metals in Biology: From Transition Metal Metabolism to Transition Metal Signaling.Anal Chem. 2017 Jan 3;89(1):22-41. doi: 10.1021/acs.analchem.6b04631. Epub 2016 Dec 15. Anal Chem. 2017. PMID: 27976855 Free PMC article. Review. No abstract available.
-
A hierarchy of manganese competition and entry in organotypic hippocampal slice cultures.NMR Biomed. 2021 Apr;34(4):e4476. doi: 10.1002/nbm.4476. Epub 2021 Feb 3. NMR Biomed. 2021. PMID: 33538073 Free PMC article.
-
Nano-imaging trace elements at organelle levels in substantia nigra overexpressing α-synuclein to model Parkinson's disease.Commun Biol. 2020 Jul 9;3(1):364. doi: 10.1038/s42003-020-1084-0. Commun Biol. 2020. PMID: 32647232 Free PMC article.
-
Improved Micro-X-ray Fluorescence Confocal Imaging of Two-Dimensional Distribution of Arsenic Concentration in Cucumber Hypocotyls Using Synchrotron Radiation.Anal Chem. 2021 Aug 31;93(34):11660-11668. doi: 10.1021/acs.analchem.1c00579. Epub 2021 Aug 17. Anal Chem. 2021. PMID: 34403244 Free PMC article.
References
-
- Maret W. Zinc and human disease In: Sigel A, Sigel H, Sigel RKO, editors. Imterrelations betwen Essential Metal Ions and Human Disease, Metal Ions in Life Sciences. 13: Springer; 2013. p. 389–414. - PubMed
MeSH terms
Substances
Grants and funding
LinkOut - more resources
Full Text Sources
Other Literature Sources
Medical
Miscellaneous
