Identifying Aspects of the Post-Transcriptional Program Governing the Proteome of the Green Alga Micromonas pusilla
- PMID: 27434306
- PMCID: PMC4951065
- DOI: 10.1371/journal.pone.0155839
Identifying Aspects of the Post-Transcriptional Program Governing the Proteome of the Green Alga Micromonas pusilla
Abstract
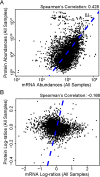
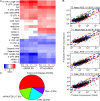
Micromonas is a unicellular motile alga within the Prasinophyceae, a green algal group that is related to land plants. This picoeukaryote (<2 μm diameter) is widespread in the marine environment but is not well understood at the cellular level. Here, we examine shifts in mRNA and protein expression over the course of the day-night cycle using triplicated mid-exponential, nutrient replete cultures of Micromonas pusilla CCMP1545. Samples were collected at key transition points during the diel cycle for evaluation using high-throughput LC-MS proteomics. In conjunction, matched mRNA samples from the same time points were sequenced using pair-ended directional Illumina RNA-Seq to investigate the dynamics and relationship between the mRNA and protein expression programs of M. pusilla. Similar to a prior study of the marine cyanobacterium Prochlorococcus, we found significant divergence in the mRNA and proteomics expression dynamics in response to the light:dark cycle. Additionally, expressional responses of genes and the proteins they encoded could also be variable within the same metabolic pathway, such as we observed in the oxygenic photosynthesis pathway. A regression framework was used to predict protein levels from both mRNA expression and gene-specific sequence-based features. Several features in the genome sequence were found to influence protein abundance including codon usage as well as 3' UTR length and structure. Collectively, our studies provide insights into the regulation of the proteome over a diel cycle as well as the relationships between transcriptional and translational programs in the widespread marine green alga Micromonas.
Conflict of interest statement
Figures


Similar articles
-
Responses of the picoprasinophyte Micromonas commoda to light and ultraviolet stress.PLoS One. 2017 Mar 9;12(3):e0172135. doi: 10.1371/journal.pone.0172135. eCollection 2017. PLoS One. 2017. PMID: 28278262 Free PMC article.
-
Evidence-based green algal genomics reveals marine diversity and ancestral characteristics of land plants.BMC Genomics. 2016 Mar 31;17:267. doi: 10.1186/s12864-016-2585-6. BMC Genomics. 2016. PMID: 27029936 Free PMC article.
-
Growth on ATP Elicits a P-Stress Response in the Picoeukaryote Micromonas pusilla.PLoS One. 2016 May 11;11(5):e0155158. doi: 10.1371/journal.pone.0155158. eCollection 2016. PLoS One. 2016. PMID: 27167623 Free PMC article.
-
Revision of the Genus Micromonas Manton et Parke (Chlorophyta, Mamiellophyceae), of the Type Species M. pusilla (Butcher) Manton & Parke and of the Species M. commoda van Baren, Bachy and Worden and Description of Two New Species Based on the Genetic and Phenotypic Characterization of Cultured Isolates.Protist. 2017 Nov;168(5):612-635. doi: 10.1016/j.protis.2017.09.002. Epub 2017 Sep 14. Protist. 2017. PMID: 29028580
-
Insights into the Regulation of Algal Proteins and Bioactive Peptides Using Proteomic and Transcriptomic Approaches.Molecules. 2019 May 2;24(9):1708. doi: 10.3390/molecules24091708. Molecules. 2019. PMID: 31052532 Free PMC article. Review.
Cited by
-
Responses of the picoprasinophyte Micromonas commoda to light and ultraviolet stress.PLoS One. 2017 Mar 9;12(3):e0172135. doi: 10.1371/journal.pone.0172135. eCollection 2017. PLoS One. 2017. PMID: 28278262 Free PMC article.
-
Bioengineering of Microalgae: Recent Advances, Perspectives, and Regulatory Challenges for Industrial Application.Front Bioeng Biotechnol. 2020 Sep 3;8:914. doi: 10.3389/fbioe.2020.00914. eCollection 2020. Front Bioeng Biotechnol. 2020. PMID: 33014997 Free PMC article. Review.
-
Specialized proteomic responses and an ancient photoprotection mechanism sustain marine green algal growth during phosphate limitation.Nat Microbiol. 2018 Jul;3(7):781-790. doi: 10.1038/s41564-018-0178-7. Epub 2018 Jun 25. Nat Microbiol. 2018. PMID: 29946165
-
Spatial Variability of Picoeukaryotic Communities in the Mariana Trench.Sci Rep. 2018 Oct 18;8(1):15357. doi: 10.1038/s41598-018-33790-4. Sci Rep. 2018. PMID: 30337591 Free PMC article.
References
-
- Foulon E, Not F, Jalabert F, Cariou T, Massana R, Simon N. Ecological niche partitioning in the picoplanktonic green alga Micromonas pusilla: evidence from environmental surveys using phylogenetic probes. Environ Microbiol. 2008;10(9):2433–43. Epub 2008/06/10. [pii] 10.1111/j.1462-2920.2008.01673.x . - DOI - PubMed
MeSH terms
Substances
LinkOut - more resources
Full Text Sources
Other Literature Sources

