. 2016 Jul 19;14(7):e1002511.
doi: 10.1371/journal.pbio.1002511. eCollection 2016 Jul.

Role of Mitochondrial Dynamics in Neuronal Development: Mechanism for Wolfram Syndrome

Affiliations

Role of Mitochondrial Dynamics in Neuronal Development: Mechanism for Wolfram Syndrome

Michal Cagalinec et al. PLoS Biol. .

Abstract

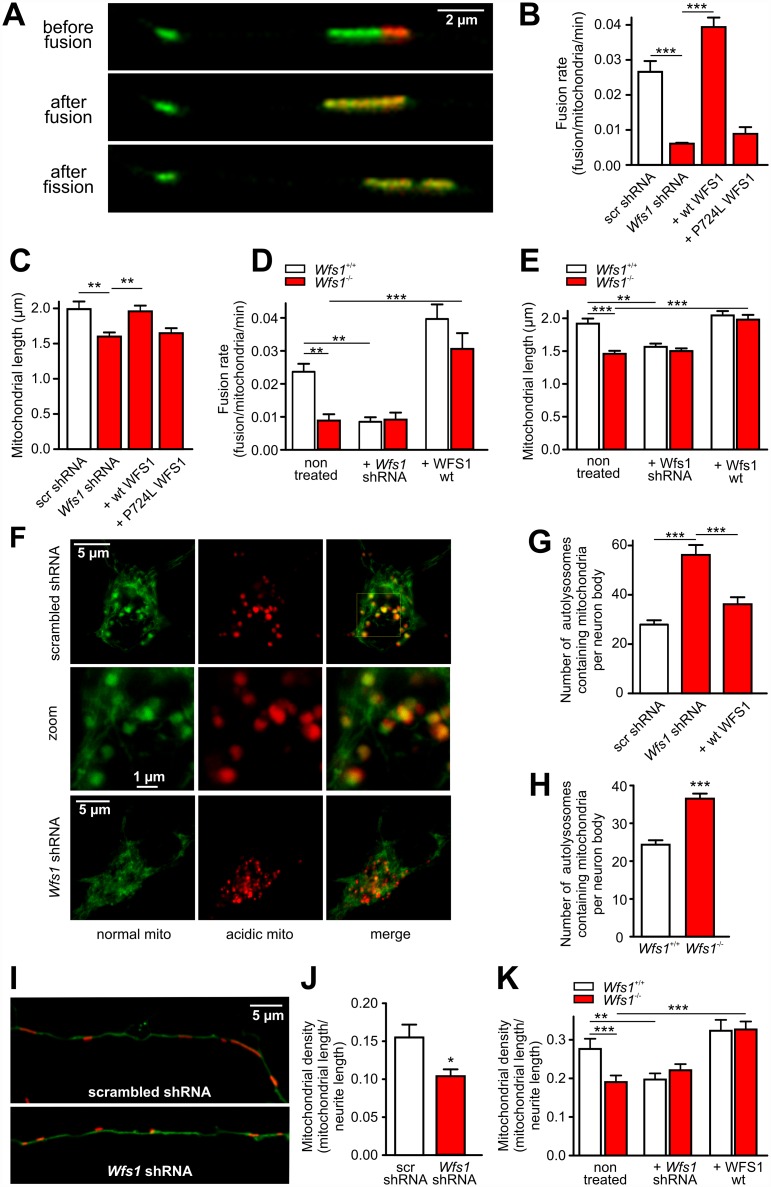
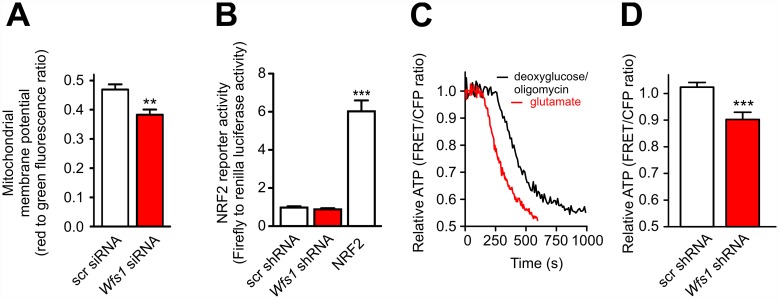
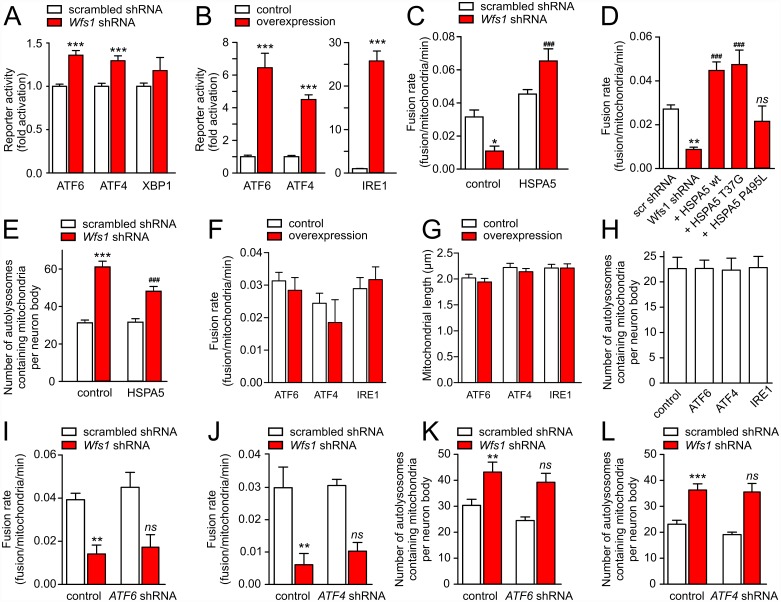
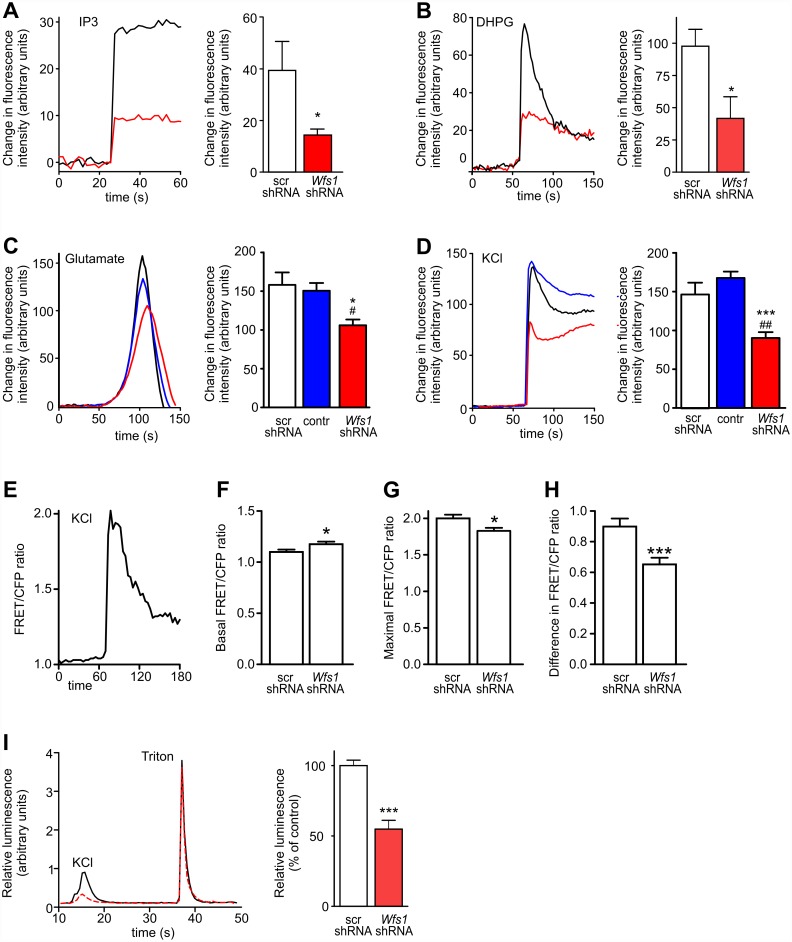
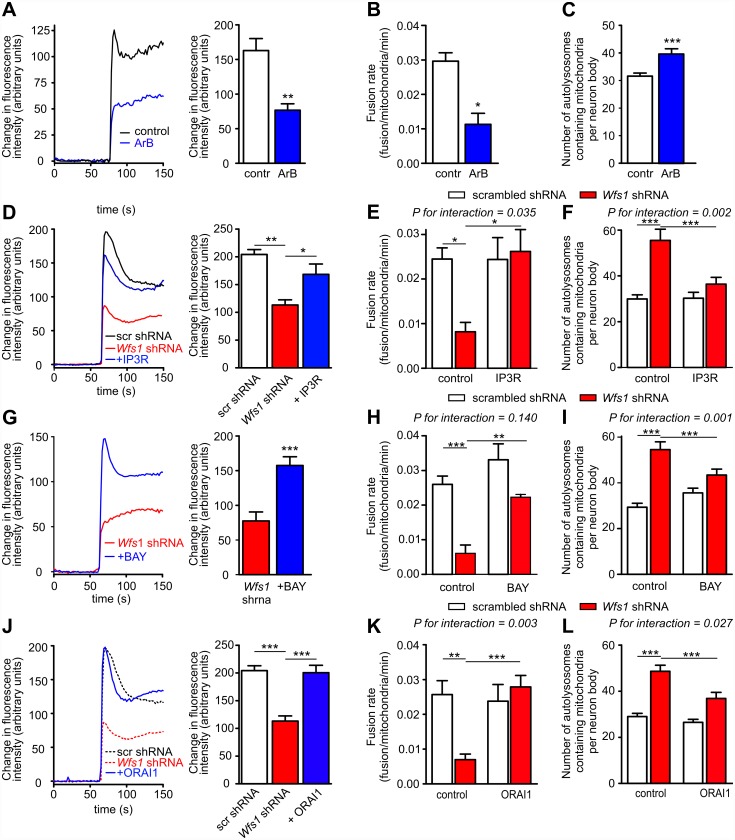
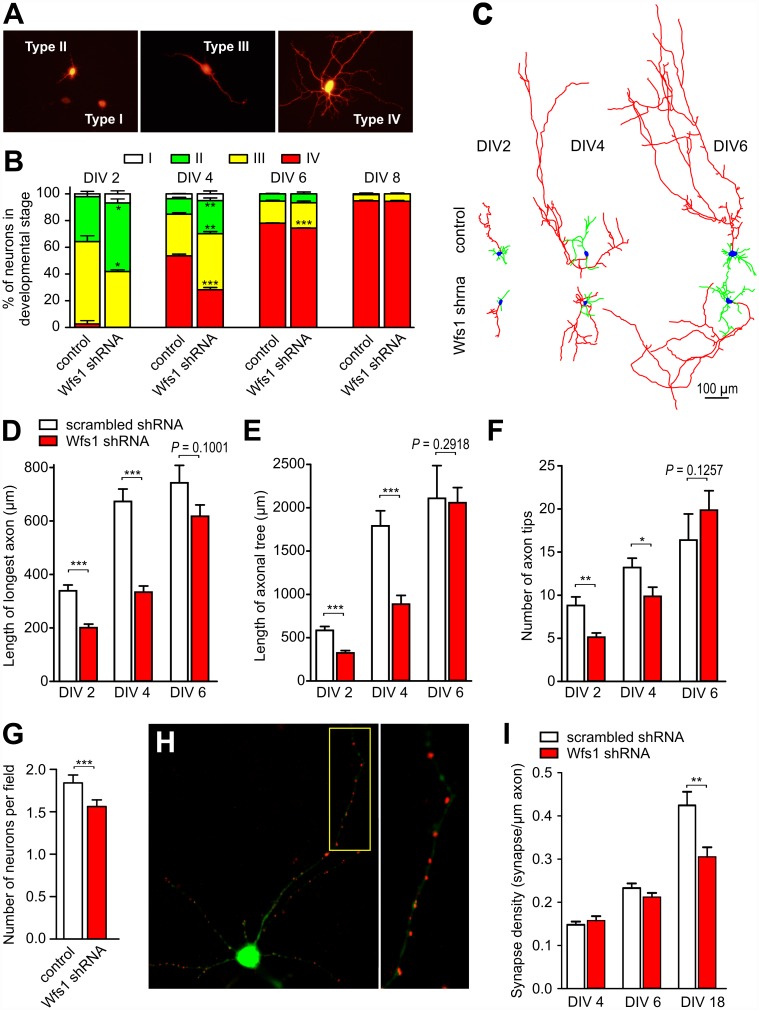
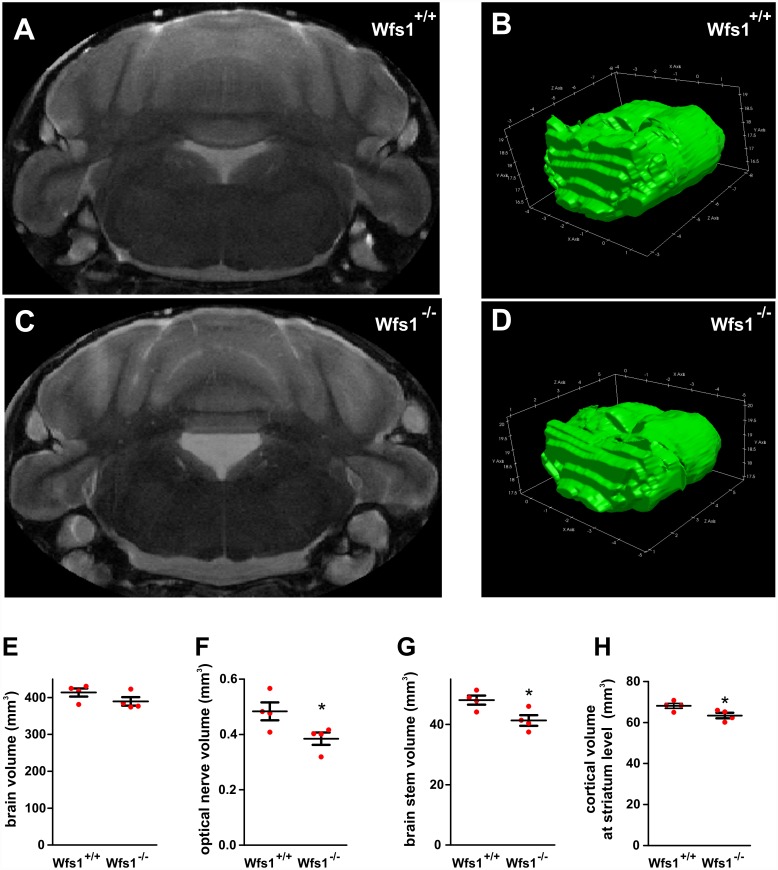
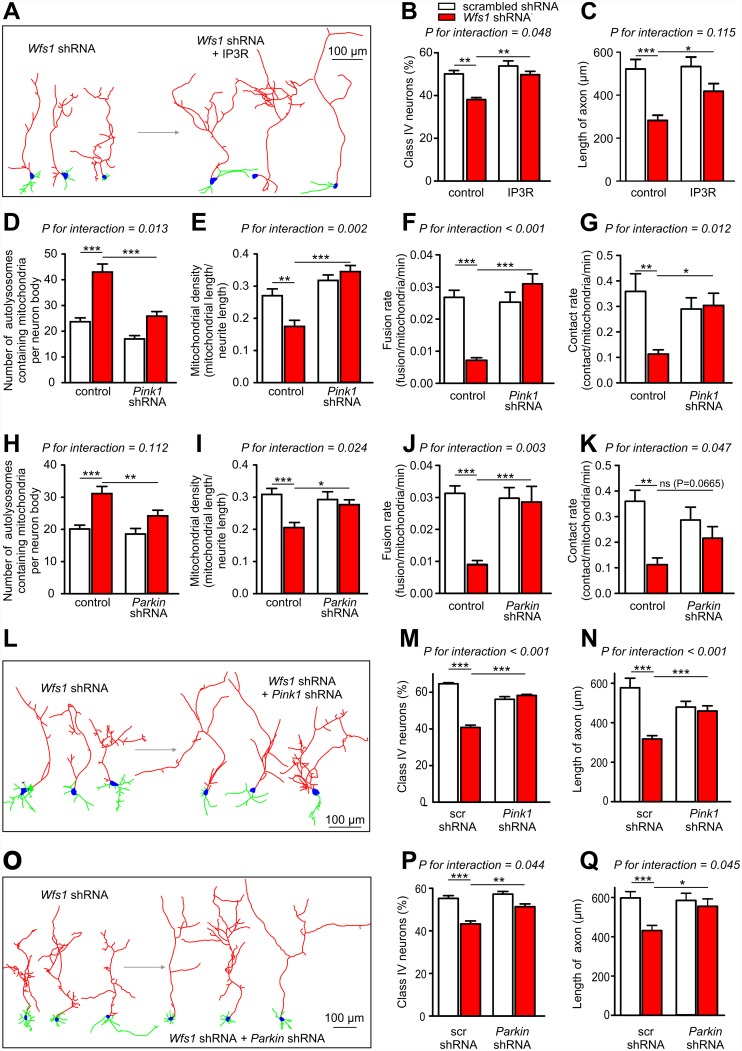
Deficiency of the protein Wolfram syndrome 1 (WFS1) is associated with multiple neurological and psychiatric abnormalities similar to those observed in pathologies showing alterations in mitochondrial dynamics. The aim of this study was to examine the hypothesis that WFS1 deficiency affects neuronal function via mitochondrial abnormalities. We show that down-regulation of WFS1 in neurons leads to dramatic changes in mitochondrial dynamics (inhibited mitochondrial fusion, altered mitochondrial trafficking, and augmented mitophagy), delaying neuronal development. WFS1 deficiency induces endoplasmic reticulum (ER) stress, leading to inositol 1,4,5-trisphosphate receptor (IP3R) dysfunction and disturbed cytosolic Ca2+ homeostasis, which, in turn, alters mitochondrial dynamics. Importantly, ER stress, impaired Ca2+ homeostasis, altered mitochondrial dynamics, and delayed neuronal development are causatively related events because interventions at all these levels improved the downstream processes. Our data shed light on the mechanisms of neuronal abnormalities in Wolfram syndrome and point out potential therapeutic targets. This work may have broader implications for understanding the role of mitochondrial dynamics in neuropsychiatric diseases.


Conflict of interest statement

The authors have declared that no competing interests exist.

Figures

Fig 1
Fig 1. WFS1 deficiency impairs mitochondrial dynamics.
(A) Primary cortical neurons were transfected with the photoconvertible mitochondrially targeted construct mito-Kikume-Green and scrambled shRNA or Wfs1 shRNA. Selected mitochondria were irradiated using a 405-nm laser line, thereby converting mito-Kikume-Green into mito-Kikume-Red. Fusion events between mito-Kikume-Green and photoactivated mito-Kikume-Red mitochondria are visible when mitochondria become yellow after mixing of the contents of the red and green mitochondria. (B–E) In primary cortical neurons, Wfs1 shRNA significantly decreases fusion rate (B) and mitochondrial length (C). These parameters are restored by overexpression of wild-type (wt) WFS1 but not by P724L WFS1, a mutant found in Wolfram syndrome. Similar changes are observed in cortical neurons isolated from Wfs1-/- mice. The lower fusion rate (D) and reduced mitochondrial length (E) in Wfs1-/- neurons is restored by wt WFS1 overexpression, but Wfs1 shRNA has no effect on these parameters. (F–H) Primary cortical neurons were transfected with mitochondrially targeted Keima (which changes its excitation spectrum under acidic conditions) and scrambled shRNA or Wfs1 shRNA (F). The number of autolysosomes containing mitochondria increases in Wfs1-silenced neurons (G) and in neurons isolated from Wfs1-/- mice (H). (I–K) Representative images of mitochondrial morphology and density in the axons of scrambled- and Wfs1-shRNA transfected neurons (I). The density of axonal mitochondria is reduced in Wfs1-silenced neurons (J) and in neurons isolated from Wfs1-/- mice (K). This parameter is restored by wt WFS1 overexpression, but Wfs1 shRNA has no effect. *p < 0.05, **p < 0.01, and ***p < 0.001 compared with respective control groups. Underlying data is shown in S1 Data.
Fig 2
Fig 2. WFS1 deficiency decreases mitochondrial membrane potential and cytosolic ATP level.
(A) Primary cortical neurons were transfected with control or Wfs1 siRNA using the N-TER nanoparticle siRNA transfection system and stained with JC-10, which emits light from 525 nm to 590 nm, depending on mitochondrial membrane potential. Values shown are corrected by subtracting the values obtained in the presence of FCCP incubation (5 μM). The red to green fluorescence ratio demonstrated a slight but significant decrease in the Wfs1 siRNA group. (B) Neurons were transfected with plasmids expressing scrambled shRNA or Wfs1 shRNA, firefly luciferase construct containing NRF2 binding site, and Renilla luciferase. Firefly luciferase signal normalized to Renilla signal demonstrates no change in NRF2 activity. NRF2 overexpression-induced reporter activity was used as a positive control. (C) Neurons transfected with the ATP sensor ATeam and treated with 2-deoxyglucose (12 mM)/oligomycin (2.5 μM) or glutamate (2 mM) (both used as positive controls) show a decrease in relative cytosolic ATP levels. (D) Neurons were transfected with the ATP sensor ATeam and scrambled or Wfs1 shRNAs. WFS1-deficient neurons show a lower cytosolic ATP level as compared to control. **p < 0.01 and ***p < 0.001 compared with respective control group. Underlying data is shown in S1 Data.
Fig 3
Fig 3. WFS1 deficiency induces mild ER stress in primary cortical neurons.
(A) Neurons were transfected with plasmids expressing scrambled shRNA or Wfs1 shRNA, firefly luciferase constructs containing ATF6 or ATF4 binding sites or a XBP-1 splicing reporter, and Renilla luciferase. Firefly luciferase signal normalized to Renilla signal demonstrates a moderate increase in ATF6 and ATF4 reporter activity. (B) Positive control experiments in which the above-mentioned reporter systems and Renilla luciferase were co-transfected with ATF4, ATF6, or IRE1. (C) The mitochondrial fusion rate is reduced by Wfs1 shRNA and is restored by co-expressing wt HSPA5 (p = 0.001 for interaction, two-way ANOVA). (D) ATPase-deficient HSPA5 mutant (T37G) but not peptide binding-deficient mutant (P495L) restores the fusion rate reduced by Wfs1 shRNA. (E) HSPA5 overexpression attenuates mitophagy activated by Wfs1 silencing (p = 0.012 for interaction). (F–H) Activation of the primary ER stress pathways by overexpression of ATF6, ATF4, or IRE1 modulates neither fusion rate (F), mitochondrial length (G), nor mitophagy (H). (I–L) Silencing of ATF6 or ATF4 modulates neither fusion rate (I, J) nor mitophagy (K, L). *p < 0.05, **p < 0.01, and ***p < 0.001 compared with respective control groups, or ###p < 0.001 compared with the Wfs1 shRNA-transfected control group and ns non-significant compared with the Wfs1 shRNA-transfected control group. Underlying data is shown in S1 Data.
Fig 4
Fig 4. WFS1 deficiency leads to impaired IP3R-mediated ER calcium release and disturbed Ca2+ homeostasis in primary cortical neurons.
(A–D) Neurons transfected with the mitochondrial marker mKate2-mito, scrambled shRNA (black line), or Wfs1 shRNA (red line) were loaded with the Ca2+ sensor Fluo-4. The left panels show time-dependent responses of cytosolic Ca2+ to various challenges, and the right panels show the mean changes in fluorescence intensity. Cells were co-loaded with the membrane-permeant caged derivative of IP3, and the latter was uncaged by irradiating individual cells with a 405-nm laser (A). Cytosolic Ca2+ transients were induced by 200 μM DHPG (B), 2 mM glutamate (C), or 25 mM KCl (D). Graphs depicting glutamate- and KCl-induced Ca2+ transients also include an additional control group (blue line) when non-transfected neurons in Wfs1 shRNA experiments were analysed. (E–H) Cytosolic Ca2+ transients (E) were elicited by 25 mM KCl in neurons transfected with the FRET-based cytosolic Ca2+ sensor cytoD3cpv and scrambled shRNA or Wfs1 shRNA. In WFS1-deficient neurons, basal cytosolic Ca2+ is higher (F) and stimulated maximal cytosolic Ca2+ is lower (G) so that the amplitude of Ca2+ transient decreases (H). (I) Neurons were transfected with aequorin and with scrambled shRNA (black line) or Wfs1 shRNA (red line). Cytosolic Ca2+ transients were triggered by 100 mM KCl, after which the cells were lysed with Triton X-100 to measure maximal activity of aequorin. The left panel demonstrates the time course of luminescence change; the right panel shows relative luminescence values (KCl to Triton X-100 ratio) normalised to control conditions. *p < 0.05 and ***p < 0.001 compared with scrambled shRNA, or #p < 0.05 and ##p < 0.01 compared with the non-transfected control group. Underlying data is shown in S1 Data.
Fig 5
Fig 5. Cytosolic Ca2+ homeostasis regulates the mitochondrial fusion rate and mitophagy in primary cortical neurons.
(A–C) The IP3R inhibitor Araguspongin B (5 μM) decreases KCl-induced Ca2+ transients (A), reduces the mitochondrial fusion rate (B), and increases mitophagy in control neurons (C). For D–L, neurons were transfected with the mitochondrial marker mKate2-mito and scrambled shRNA (white bars) or Wfs1 shRNA (red bars). (D–F) Under conditions of WFS1 deficiency, IP3R overexpression restores the depressed cytosolic Ca2+ response to 25 mM KCl (D) and normalises the mitochondrial fusion rate (E) and mitophagy (F). (G–I) Similarly, under conditions of WFS1 deficiency, the L-type Ca2+ channel agonist Bay K 8644 (5 μM) increases the cytosolic Ca2+ response to KCl (G) and normalises the mitochondrial fusion rate (H) and mitophagy (I). (J–L) Overexpression of ORAI1 has similar effects (dotted lines in J represent responses of cells treated with scrambled or Wfs1 shRNAs already shown in D). *p < 0.05, ** p < 0.01, and *** p < 0.001 versus indicated groups. P-values for interactions are given in the figures. Underlying data is shown in S1 Data.
Fig 6
Fig 6. WFS1 deficiency leads to impaired neuronal development.
Primary cortical neurons were transfected with the neuronal marker pAAV-hSyn-DsRed1 and scrambled shRNA or Wfs1 shRNA at DIV (day in vitro) 1, and neuronal morphology was assessed at different time points. (A) Cell morphology at different stages of development. (B) Morphological analysis demonstrating the retarded development of WFS1-deficient neurons. (C) Examples of reconstructed control and WFS1-deficient neurons at different DIV. (D–F) WFS1 deficiency retards growth of the longest axon (D) and growth of the axonal tree (E) and decreases the number of axon tips (F). (G) Survival of WFS1-deficient neurons is decreased when compared with control neurons (n = 61–62 individual dishes from 17 independent sister cultures at DIV 6–11). (H) Visualisation of synapses (red) using an antibody targeted against the post-synaptic marker PSD-95 in neurons transfected with GFP (green). The right panel shows a zoomed image. (I) WFS1-deficiency decreases synaptic density at late stages. *p < 0.05, **p < 0.01, and ***p < 0.001 compared with respective scrambled shRNA-treated groups. Underlying data is shown in S1 Data.
Fig 7
Fig 7. WFS1 deficiency is associated with reduced volume of the optic nerve, brain stem, and cortex at the level of the striatum.
(A–D) Brains, within skulls, were scanned ex vivo using a 94/20 Bruker BioSpec MRI. Representative single coronal slice from the imaging sequence (A, C) and a 3D reconstruction of the brain stem (B, D). The outer skull, tissue, and surrounding medium have been removed for clarity. (E–H) Volumetric analysis of brains from Wfs +/+ and -/- male mice: whole brain (E), optic nerve (F), brain stem (G), and cortical volumes at the level of striatum (H). *p < 0.05 and **p < 0.01 compared with Wfs +/+, groups (n = 4 animals in each group).
Fig 8
Fig 8. Overexpression of IP3R or blocking mitophagy rescues impaired neuronal development in Wfs1 deficiency.
(A–C) Examples of reconstructed WFS1-deficient neurons co-transfected with IP3R (A). Under conditions of WFS1 deficiency, overexpression of IP3R normalises the percentage of mature neurons (stage IV) at DIV4 (B) and axon lengths (C). (D–G) Pink1 silencing normalises mitophagy (D), mitochondrial density (E), fusion (F), and contact rate (G). (H–K) Parkin silencing shows similar effects on all these parameters. (L–N) Examples of reconstructed WFS1-deficient neurons co-transfected with PINK1 shRNA (L). PINK1 silencing normalises the percentage of mature neurons (stage IV) at DIV4 (M) and axon lengths (N). Similarly, Parkin silencing corrects neuronal maturation and axonal growth (O–Q). White bars = scrambled shRNA, red bars = Wfs1 shRNA. * p < 0.05, ** p < 0.01, and *** p < 0.001 versus indicated group. P-values for interactions are given in the figure. Underlying data is shown in S1 Data.

References

    1. Barrett TG, Bundey SE, Fielder AR, Good PA. Optic atrophy in Wolfram (DIDMOAD) syndrome. Eye. 1997;11:882–888. - PubMed
    1. Hershey T, Lugar HM, Shimony JS, Rutlin J, Koller JM, Perantie DC, et al. Early brain vulnerability in Wolfram syndrome. PLoS ONE. 2012;7:e40604 10.1371/journal.pone.0040604 - DOI - PMC - PubMed
    1. Osman AA, Saito M, Makepeace C, Permutt MA, Schlesinger P, Mueckler MJ. Wolframin expression induces novel ion channel activity in endoplasmic reticulum membranes and increases intracellular calcium. J Biol Chem. 2003;278:52755–52762. - PubMed
    1. Takei D, Ishihara H, Yamaguchi S, Yamada T, Tamura A, Katagiri H, et al. WFS1 protein modulates the free Ca(2+) concentration in the endoplasmic reticulum. FEBS Lett. 2006;580:5635–5640. - PubMed
    1. Fonseca SG, Fukuma M, Lipson KL, Nguyen LX, Allen JR, Oka Y, et al. WFS1 is a novel component of the unfolded protein response and maintains homeostasis of the endoplasmic reticulum in pancreatic beta-cells. J Biol Chem. 2005;280:39609–39615. - PubMed

MeSH terms

LinkOut - more resources