. 2016 Sep;24(9):1686-96.
doi: 10.1038/mt.2016.122. Epub 2016 Jun 20.

Coadministration of a Plasmid Encoding HIV-1 Gag Enhances the Efficacy of Cancer DNA Vaccines

Affiliations

Coadministration of a Plasmid Encoding HIV-1 Gag Enhances the Efficacy of Cancer DNA Vaccines

Laure Lambricht et al. Mol Ther. 2016 Sep.

Abstract

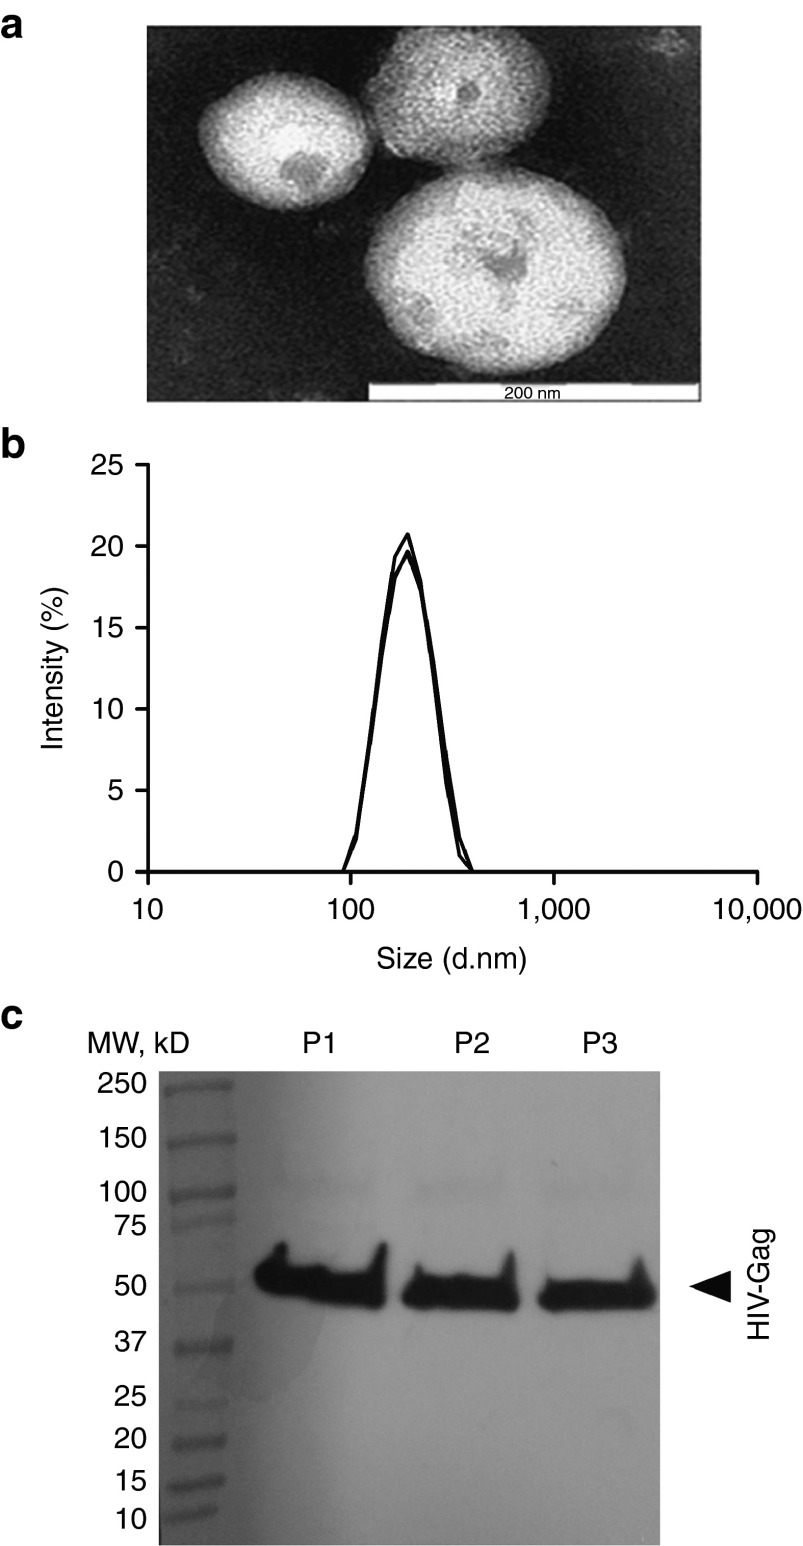
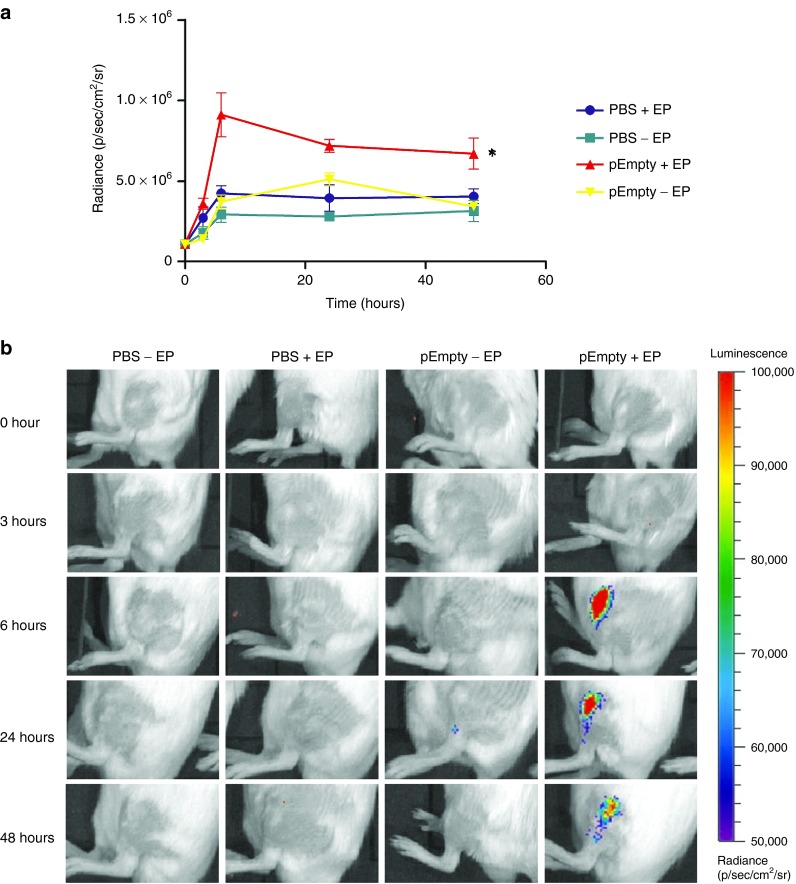
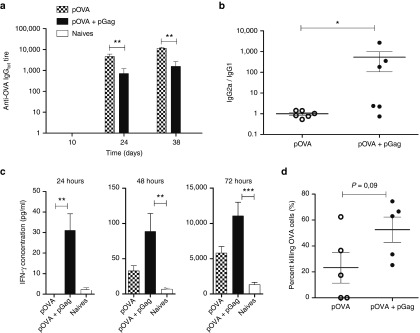
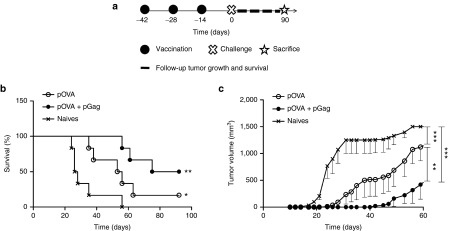
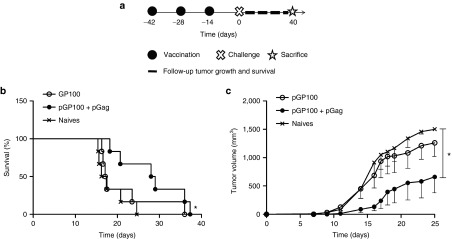
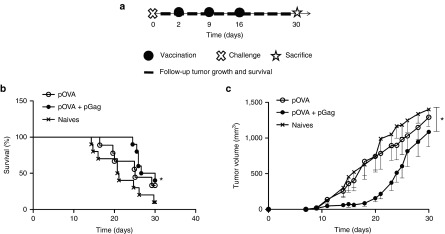
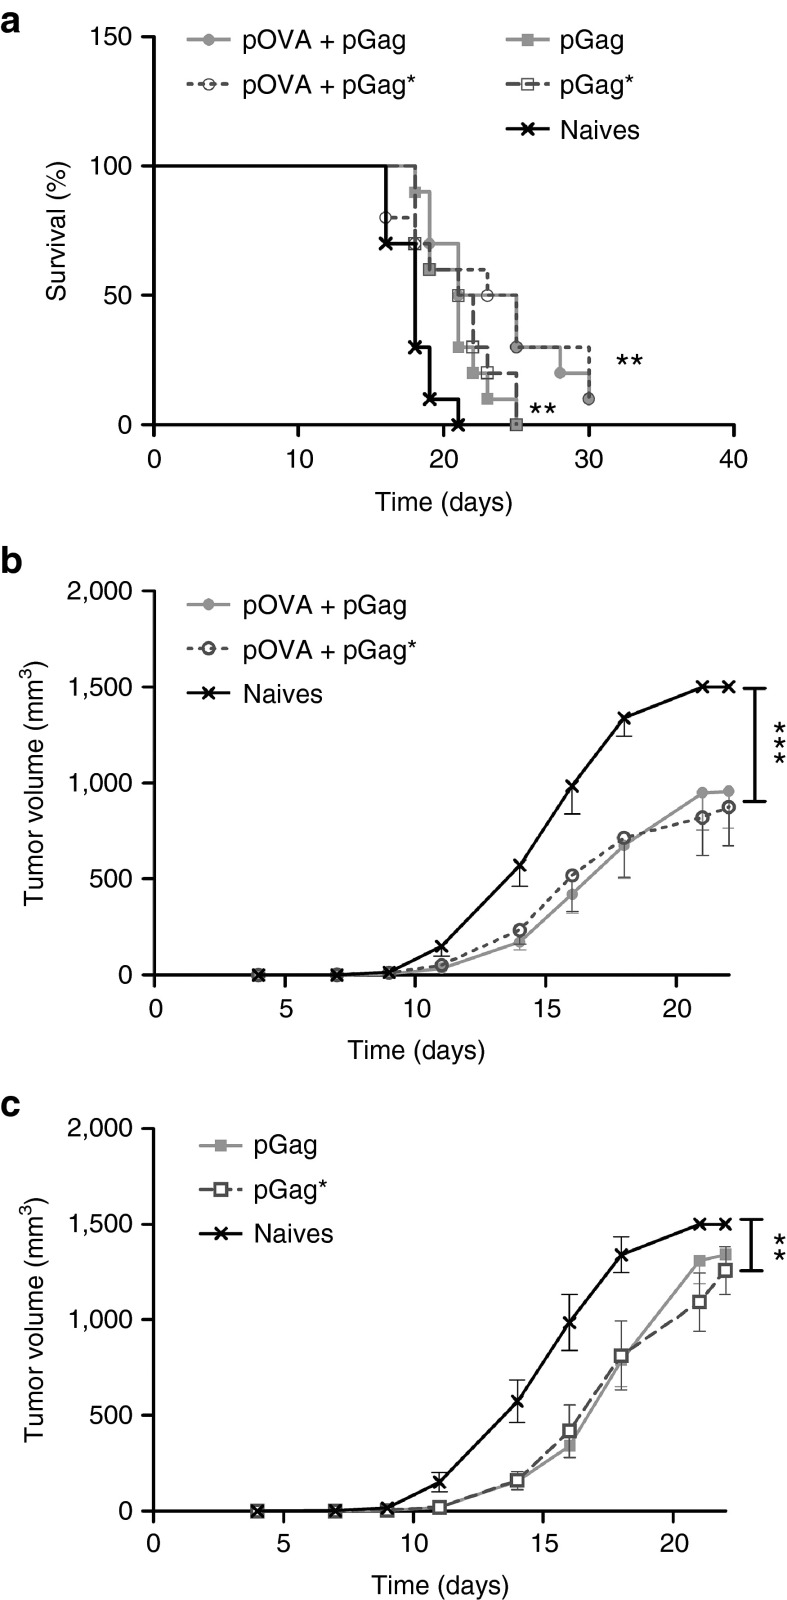
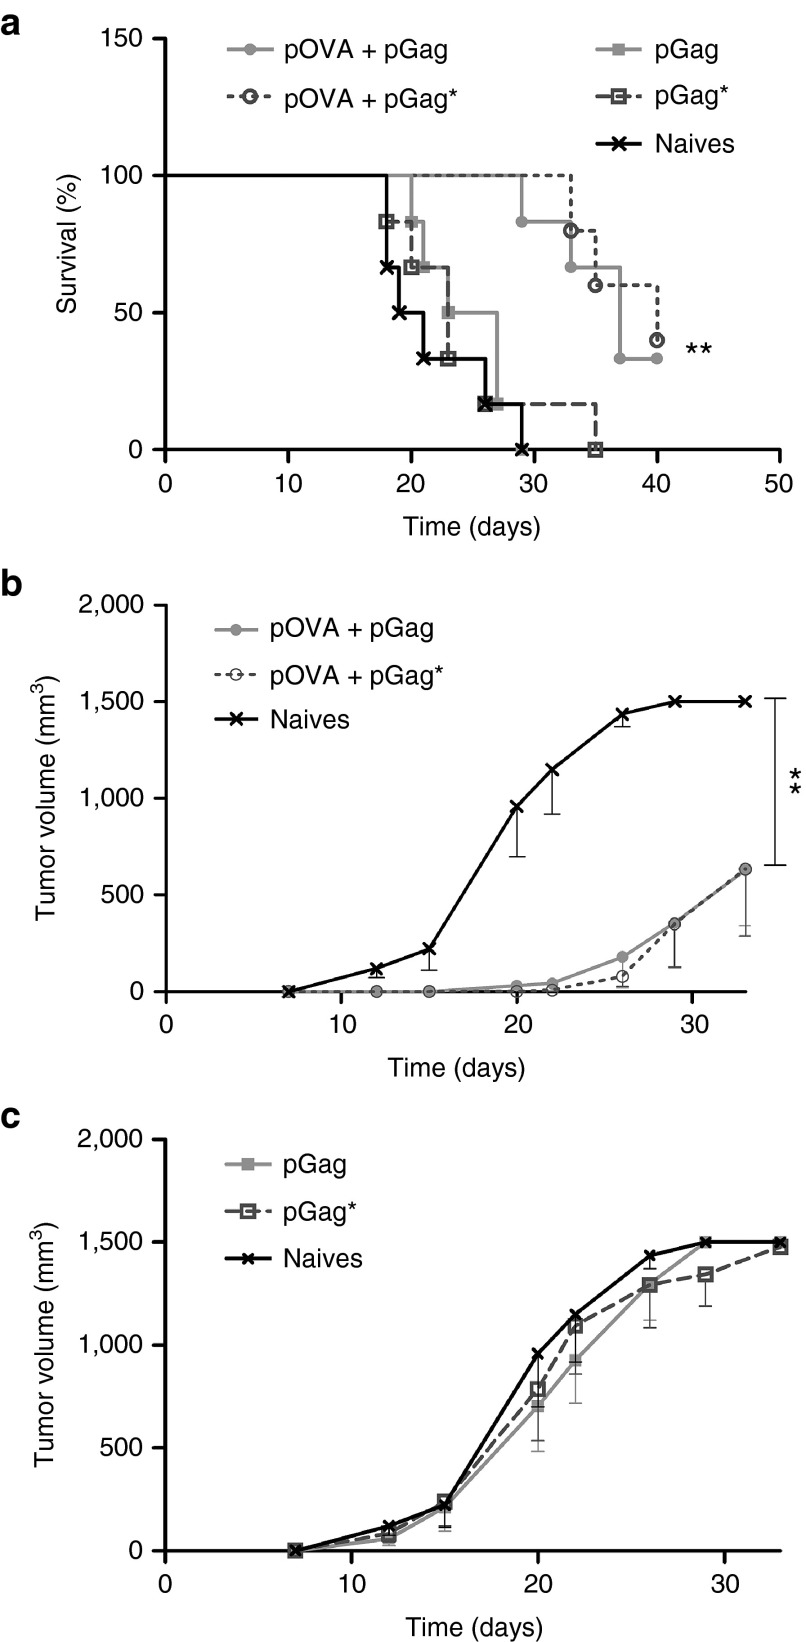
DNA vaccination holds great promise for the prevention and treatment of cancer and infectious diseases. However, the clinical ability of DNA vaccines is still controversial due to the limited immune response initially observed in humans. We hypothesized that electroporation of a plasmid encoding the HIV-1 Gag viral capsid protein would enhance cancer DNA vaccine potency. DNA electroporation used to deliver plasmids in vivo, induced type I interferons, thereby supporting the activation of innate immunity. The coadministration of ovalbumin (OVA) and HIV-1 Gag encoding plasmids modulated the adaptive immune response. This strategy favored antigen-specific Th1 immunity, delayed B16F10-OVA tumor growth and improved mouse survival in both prophylactic and therapeutic vaccination approaches. Similarly, a prophylactic DNA immunization against the melanoma-associated antigen gp100 was enhanced by the codelivery of the HIV-1 Gag plasmid. The adjuvant effect was not driven by the formation of HIV-1 Gag virus-like particles. This work highlights the ability of both electroporation and the HIV-1 Gag plasmid to stimulate innate immunity for enhancing cancer DNA vaccine immunogenicity and demonstrates interesting tracks for the design of new translational genetic adjuvants to overcome the current limitations of DNA vaccines in humans.


Figures

Figure 1
Figure 1
The characterization of HIV-1 Gag virus-like particles (VLPs). VLPs purified from the supernatants of HEK 293T cells transfected with HIV-1 Gag plasmid. (a) Particles observed by transmission electron microscopy after purification and negative staining of samples. This image is representative of data from three replicate experiments. Bare scale: 200 nm. (b) Individual measurement of particle size by DLS (n = 3). Particle size is calculated from the translational diffusion coefficient using the Stokes–Einstein equation. (c) Western blot analysis of three replicate productions of VLPs purified by ultracentrifugation (P1, P2, P3) with rabbit polyclonal antibodies to HIV-1 Gag as primary antibodies and polyclonal goat anti-rabbit immunoglobulins labeled with biotin as secondary antibodies. The HIV-1 Gag protein was detected at ~56 kDa.
Figure 2
Figure 2
The effect of plasmid electroporation on type 1 interferon (IFN) expression. Groups of naive heterozygous luciferase reporter mice (IFN-β+/Δβ-luc) were treated with phosphate buffered saline (PBS) or an empty plasmid (pEmpty) before applying eight 20 ms and 200 V/cm electric pulses with plate electrodes (+EP) or not (−EP). Type 1 IFN expression was quantified by in vivo bioluminescence imaging following i.p. injection of luciferin. (a) Radiance was observed at 0, 3, 6, 24, and 48 hours following treatment. The results are presented as the mean ± SEM (n = 4). The asterisks indicate significant differences compared to the control group PBS without EP (*P < 0.05) (Friedman test and Dunn's post-hoc test). (b) Representative imaging of the mice as a function of treatment and time. Color presentation indicates the intensity of bioluminescence, as shown in the bar.
Figure 3
Figure 3
The effect of pGag codelivery during anti-ovalbumin (OVA) immunization on the immune response. C57BL/6 mice were immunized in a regimen of one prime and two boosts at a 2-week interval with the antigenic OVA plasmid combined or not with the HIV-1 Gag plasmid. (a) OVA-specific total IgG titers were measured by enzyme-linked immunosorbent assays (ELISAs) in the sera of mice collected at experimental days 10, 24, and 38 (10 days after each vaccine delivery, considering day 0 as the priming day). The error bars indicate mean ± SEM (n = 6). The asterisks indicate significant differences between groups (**P < 0.01) (Mann–Whitney U-test and Bonferroni tests). (b) Antibody isotypes were analyzed in sera of mice randomly collected 10 days after the last boost. Individual IgG1 and IgG2a titers were measured by ELISAs and each mouse was characterized by an IgG2a/IgG1 ratio (*P < 0.05) (Mann–Whitney U-test). (c) To analyze OVA-specific IFN-γ levels, mice were immunized and sacrificed 1 week after the last vaccine administration. IFN-γ concentrations measured in the supernatant of mice splenocytes that had been restimulated with OVA protein 24, 48, and 72 hours before. The errors bars indicate mean ± SEM (n = 6). The asterisks indicate significant differences between groups (**P < 0.01, ***P < 0.001) (Kruskal–Wallis and Dunn's post-hoc test). (d) The percentage of antigen-specific killing was analyzed by in vivo cytotoxic assay. Immunized mice were adoptively transferred with two populations of labeled splenocytes: MHC-I OVA peptide-pulsed-target cells and a MHC-I irrelevant-peptide-pulsed cells. Two days after transfer, the specific killing of target cells was obtained by comparing the relative decrease of the two populations. Percentages of OVA target cell killing were compared using the Mann–Whitney U-test.
Figure 4
Figure 4
The effect of pGag codelivery during prophylactic anti-ovalbumin (OVA) immunization on the antitumor activity. (a) Experimental plan. C57BL/6 mice were immunized in a regimen of one prime and two boosts at a 2-week interval with the antigenic OVA plasmid combined or not with pGag. Two weeks after the last vaccination, they were challenged with B16F10-OVA cells. Tumor growth and mouse survival were assessed for 3 months. (b) Survival rates monitoring after challenge. The asterisks indicate significant differences compared with naive mice (*P < 0.05, **P < 0.01) (comparison of survival curves, Mantel–Cox test). (c) Tumor growth follow-up after challenge in mice immunized with pOVA and pOVA combined with pGag. The results are expressed as mean − SEM (n = 6). The asterisks show significant differences between groups (**P < 0.01, ***P < 0.001) (analysis of variance, Dunnett's post-hoc test).
Figure 5
Figure 5
The effect of pGag codelivery during prophylactic anti-GP100 immunization on the antitumor activity. (a) Experimental plan. C57BL/6 mice were immunized in a regimen of one prime and two boosts at a 2-week interval with the antigenic GP100 plasmid combined or not with pGag. Two weeks after the last vaccination, they were challenged with B16F10-OVA cells and tumor growth and mouse survival were monitored. (b) Survival rates monitoring after challenge. The asterisks indicate significant differences compared with naive mice (*P < 0.05) (comparison of survival curves, Mantel–Cox test). (c) Tumor growth follow-up after challenge in mice immunized with pGP100 and pGP100 combined with pGag. The results are expressed as mean − SEM (n = 6). The asterisks show significant differences between groups (*P < 0.05) (analysis of variance, Dunnett's post-hoc test).
Figure 6
Figure 6
The effect of pGag codelivery during therapeutic anti-ovalbumin (OVA) immunization on the antitumor activity. (a) Experimental plan. C57BL/6 mice were challenged with B16F10-OVA cells. Two days later, they were immunized in a regimen of one prime and two boosts at a 1-week interval with the antigenic OVA plasmid combined or not with HIV-1 Gag plasmid. Tumor growth and mouse survival were assessed after challenge. (b) Survival rates monitoring after challenge. The asterisks indicate significant differences compared with naive mice (*P < 0.05) (comparison of survival curves, Mantel–Cox test). (c) Tumor growth follow-up after challenge in mice immunized with pOVA and pOVA combined with pGag. The results are expressed as mean − SEM (n = 10). The asterisks show significant differences between groups (*P < 0.05) (analysis of variance, Dunnett's post-hoc test).
Figure 7
Figure 7
Comparison of the effect of pGag and pGag* during therapeutic anti-ovalbumin (OVA) immunization on the antitumor activity. (a) Survival rate monitoring after challenge. The asterisks indicate significant differences compared with naive mice (**P < 0.01) (comparison of survival curves, Mantel–Cox test). (b,c) Tumor growth follow-up after challenge in mice immunized respectively with pOVA combined with pGag or pGag* and mice immunized with pGag or pGag* alone. The results are expressed as mean − SEM (n = 10). The asterisks show significant differences between groups (**P < 0.01, ***P < 0.001) (analysis of variance, Dunnett's post-hoc test).
Figure 8
Figure 8
Comparison of the effect of pGag and pGag* during prophylactic anti-ovalbumin (OVA) immunization on the antitumor activity. (a) Survival rate monitoring after challenge. The asterisks indicate significant differences compared with naive mice (**P < 0.01) (comparison of survival curves, Mantel–Cox test). (b,c) Tumor growth follow-up after challenge in mice immunized respectively with pOVA combined with pGag or pGag* and mice immunized with pGag or pGag* alone. The results are expressed as mean − SEM (n = 6). The asterisks show significant differences between groups (**P < 0.01) (analysis of variance, Dunnett's post-hoc test).

Similar articles

Cited by

References

    1. Calvet, CY, Andre, FM and Mir, LM (2014). Dual therapeutic benefit of electroporation-mediated DNA vaccination in vivo: enhanced gene transfer and adjuvant activity. Oncoimmunology 3: e28540. - PMC - PubMed
    1. Donnelly, JJ, Wahren, B and Liu, MA (2005). DNA vaccines: progress and challenges. J Immunol 175: 633–639. - PubMed
    1. Braumüller, H, Wieder, T, Brenner, E, Aßmann, S, Hahn, M, Alkhaled, M et al. (2013). T-helper-1-cell cytokines drive cancer into senescence. Nature 494: 361–365. - PubMed
    1. Rosenberg, SA, Yannelli, JR, Yang, JC, Topalian, SL, Schwartzentruber, DJ, Weber, JS et al. (1994). Treatment of patients with metastatic melanoma with autologous tumor-infiltrating lymphocytes and interleukin 2. J Natl Cancer Inst 86: 1159–1166. - PubMed
    1. Castellino, F and Germain, RN (2006). Cooperation between CD4+ and CD8+ T cells: when, where, and how. Annu Rev Immunol 24: 519–540. - PubMed

Publication types

MeSH terms