. 2016 Jul 19:5:e13662.
doi: 10.7554/eLife.13662.

Structural mechanism of ligand activation in human calcium-sensing receptor

Affiliations

Structural mechanism of ligand activation in human calcium-sensing receptor

Yong Geng et al. Elife. .

Abstract

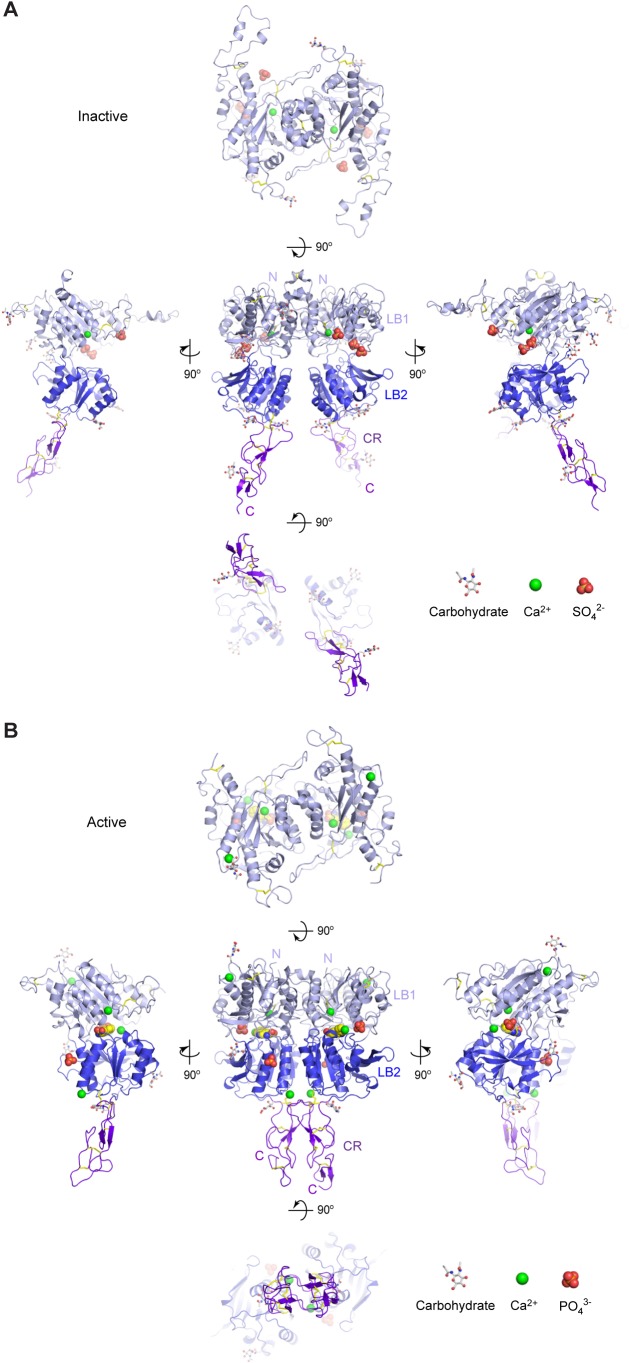
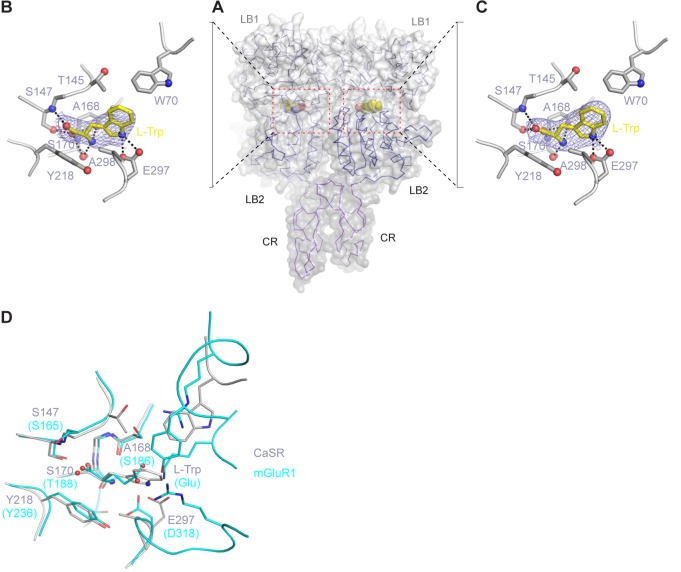
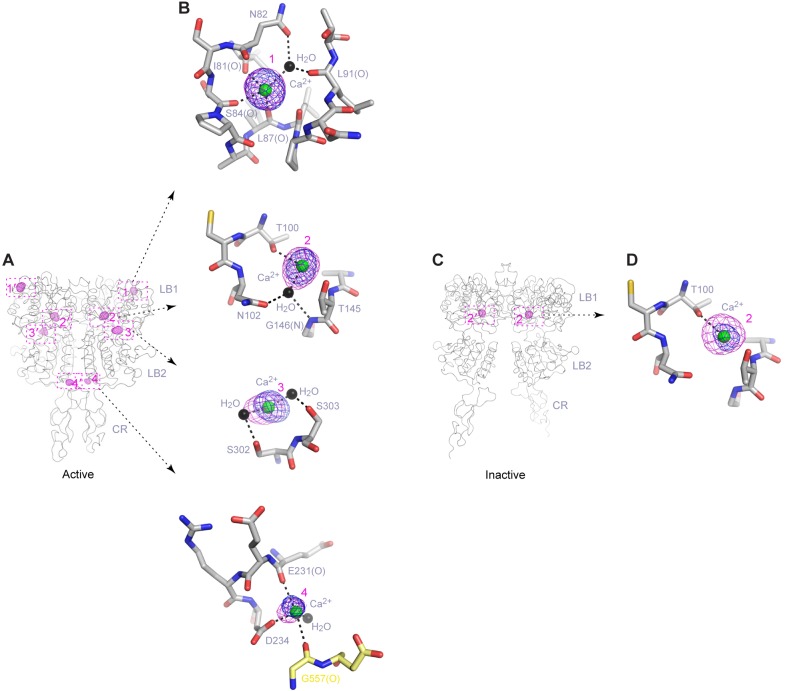
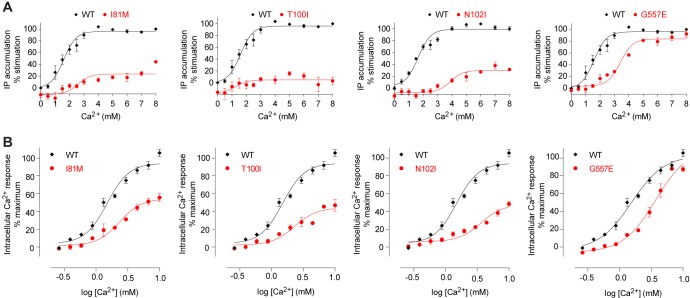
Human calcium-sensing receptor (CaSR) is a G-protein-coupled receptor (GPCR) that maintains extracellular Ca(2+) homeostasis through the regulation of parathyroid hormone secretion. It functions as a disulfide-tethered homodimer composed of three main domains, the Venus Flytrap module, cysteine-rich domain, and seven-helix transmembrane region. Here, we present the crystal structures of the entire extracellular domain of CaSR in the resting and active conformations. We provide direct evidence that L-amino acids are agonists of the receptor. In the active structure, L-Trp occupies the orthosteric agonist-binding site at the interdomain cleft and is primarily responsible for inducing extracellular domain closure to initiate receptor activation. Our structures reveal multiple binding sites for Ca(2+) and PO4(3-) ions. Both ions are crucial for structural integrity of the receptor. While Ca(2+) ions stabilize the active state, PO4(3-) ions reinforce the inactive conformation. The activation mechanism of CaSR involves the formation of a novel dimer interface between subunits.

Keywords: amino acids; biochemistry; biophysics; calcium-sensing receptor; extracellular calcium homeostasis; extracellular domain structure; human; principal agonist; receptor activation mechanism; structural biology.


Conflict of interest statement

The authors declare that no competing interests exist.

Figures

Figure 1.
Figure 1.. Crystal structures of human CaSR ECD.
(A) Inactive-state structure of CaSR ECD homodimer in the presence of 2 mM Ca2+. (B) Active-state structure of CaSR ECD homodimer in the presence of 10 mM Ca2+ and 10 mM L-Trp. Each structure is shown in cartoon (front view) or surface (side view) representations that are related by a 90°-rotation about the vertical axis. Each protomer is colored according to its individual domains (LB1, light blue; LB2, blue; CR, purple). The various ligands (L-Trp, Ca2+, PO43-, SO42-) are displayed as space-filling models. Observed carbohydrates are shown as ball-and-stick models in gray. Disulfide bridges are in yellow. DOI: http://dx.doi.org/10.7554/eLife.13662.006
Figure 1—figure supplement 1.
Figure 1—figure supplement 1.. Purification of the CaSR ECD homodimer.
(A) Superdex-200 size exclusion chromatography of secreted wild-type (wt) CaSR ECD. (B) SDS gel of wt-CaSR ECD before and after Endo H digestion under reducing condition. (C) Superdex-200 size exclusion chromatography of secreted CaSR ECD mutant carrying three glycosylation-site mutations (N386Q, S402N and N468Q). (D) SDS gel of purified CaSR ECD mutant from (C) under reducing (+DTT) and non-reducing (-DTT) conditions. (E) Dose-dependent Ca2+-stimulated IP accumulation in cells expressing wild-type or mutant CaSR. The full-length CaSR contains either two (N386Q, S402N) or three (N386Q, S402N and N468Q) glycosylation-site mutations. DOI: http://dx.doi.org/10.7554/eLife.13662.007
Figure 1—figure supplement 2.
Figure 1—figure supplement 2.. Different conformational states of CaSR ECD.
(A) Cartoon representation of the inactive (form I) CaSR ECD crystal structure. (B) Cartoon representation of the active (form II) CaSR ECD crystal structure. Each homodimer structure is shown in five views: front (center), top (top), bottom (bottom), and two side (center left and right) views. Each protomer is colored according to its individual domains (LB1, light blue; LB2, blue; CR, purple). The various ligands (L-Trp, Ca2+, PO43-, SO42-) are displayed as space-filling models. Observed carbohydrates are shown as ball-and-stick models in gray. Disulfide bridges are in yellow. DOI: http://dx.doi.org/10.7554/eLife.13662.008
Figure 2.
Figure 2.. Agonist-induced conformational changes.
(A) Superposition of the inactive (orange) and active (blue) CaSR ECD structures based on the LB1 domain of one protomer (front view, left; side view, right). Green line is the axis of rotation that relates the LB2 domains of the superimposed protomers (rotation χ = 29°, screw translation τχ = −2.2 Å). (B, C) Surface representation of inactive (B) and active (C) structures in front (top) and bottom (bottom) views. Distance between C-termini of the two subunits (yellow) is marked by dashed line for each homodimer. DOI: http://dx.doi.org/10.7554/eLife.13662.009
Figure 3.
Figure 3.. Homodimer interface.
(A) Cα trace of inactive structure with elements involved in homodimer formation highlighted by cartoons. The interface is divided into three regions I, II, and IV. Site II is further separated into two symmetrical parts II_a and II_b. Specific contacts at each interface region are shown in surrounding panels. Dashed lines indicate hydrogen bonds. (B) Cα trace of active structure showing elements involved in homodimer formation. The interface is divided into six regions, I, II, III, IV, V, and VI. Specific contacts at the interface areas III, IV, V, and VI are shown in surrounding panels. For both structures, the domains involved in dimerization at each interface region are: I: LB1-LB1; II: LB1-LB1; III: LB2-LB1; IV: LB2-LB2; V: LB2-CR; VI: CR-CR. (C) Dose-dependent Ca2+-stimulated IP accumulation in cells transiently expressing wild-type (wt) or mutant CaSR. Naturally occurring inactivating mutations L159P, R172G, D215G, R227L, R551K, and G557E are located at the homodimer interface. The single mutation W458A was designed based on structure to affect receptor homodimerization. DOI: http://dx.doi.org/10.7554/eLife.13662.010
Figure 3—figure supplement 1.
Figure 3—figure supplement 1.. Homodimer interface.
(A, B) Cα traces of inactive (A) and active (B) CaSR ECD structures. Each structure is presented in three views: top (left), front (center) and side (right). Structural elements involved in homodimer formation are highlighted by cartoons. (C, D) A detailed view of the structural elements at the homodimer interface region I of inactive (C) and active (D) CaSR ECD structures. For each structure, the angle between the D-helices of the two subunits is shown and is used to represent dimer orientation at this interface. (E, F) Cα traces of inactive (E; PDB code: 4MQE) and active (F; PDB code: 4MS4) GABAB receptor (GABABR) ECD structures. (G, H) A detailed view of the structural elements at the heterodimer interface of inactive (G) and active (H) GABABR ECD structures. For each structure, the angle between the C-helices of the two subunits is shown. (I, J) Cα traces of inactive (I; PDB code: 1EWT) and active (J; PDB code: 1EWK) mGluR1 VFT module structures. (K, L) A detailed view of the structural elements at the homodimer interface of inactive (G) and active (H) mGluR1 VFT structures. For each structure, the angle between the C-helices of the two subunits is shown. Panels (E) – (L) were adapted from Supplementary Figure 13 of (Geng et al., 2013). DOI: http://dx.doi.org/10.7554/eLife.13662.011
Figure 3—figure supplement 2.
Figure 3—figure supplement 2.. Homodimer interface.
Specific contacts at the interface areas I, II_a, and II_b of the active CaSR ECD structure. DOI: http://dx.doi.org/10.7554/eLife.13662.012
Figure 4.
Figure 4.. L-Trp recognition by CaSR ECD.
(A) Molecular surface of a L-Trp-bound CaSR ECD protomer in the active structure. L-Trp is displayed as a space-filling model. (B) Specific contacts between CaSR ECD (gray) and L-Trp (yellow). Mesh represents the final 2Fo-Fc electron density map contoured at 1σ. Hydrogen bonds are represented by dashed lines. (C) Schematic diagram of the interactions between CaSR ECD and bound L-Trp. Selected contacts are highlighted; hydrogen bonds, dashed lines; hydrophobic contacts, wiggled lines. (D) Dose-response curves of nonradioactive L-Trp inhibiting [3H]-L-Trp binding to CaSR ECD in the presence of 0 mM or 2 mM Ca2+. (EF) Dose-dependent L-Trp-induced intracellular Ca2+ mobilization at various extracellular Ca2+ concentrations in cells stably expressing CaSR. (E) Effect of increments of L-Trp (final concentrations: 0.1, 0.2, 0.5, 1.0, 2.0, 5.0, 10, 20 mM) in the presence of 1.5 mM extracellular Ca2+. The experiments were followed by an exposure to 0.5 mM extracellular Ca2+ to demonstrate reversibility of the L-Trp-induced intracellular Ca2+ oscillation, and a later exposure to 8 mM extracellular Ca2+ to demonstrate the maximal response. (F) Integrated response curves of L-Trp at 0.5, 1.5, and 2.5 mM Ca2+. Intracellular Ca2+ responses are presented in integrated response units (IRUs, F340/F380.min). (G) Effect of L-Trp on Ca2+-stimulated intracellular Ca2+ mobilization in cells transiently expressing wt CaSR. (HL) Dose-dependent Ca2+-stimulated IP accumulation in cells transiently expressing wild-type or mutant CaSR. Naturally-occurring inactivating mutations Y218S and E297K are located at the L-Trp binding site. The single mutations T145I, S147A, and S170A were designed based on structure to disrupt L-Trp recognition. DOI: http://dx.doi.org/10.7554/eLife.13662.013
Figure 4—figure supplement 1.
Figure 4—figure supplement 1.. L-Trp recognition by CaSR ECD.
(A) Molecular surface of L-Trp-bound CaSR ECD homodimer. L-Trp is displayed as a space filling model. (B, C) Specific contacts between CaSR ECD (gray) and L-Trp (yellow) within each protomer of the active structure. Mesh represents the final 2Fo-Fc electron density map contoured at 1σ. Hydrogen bonds are represented by black dashed lines. (D) Superposition of the L-Trp-binding site in CaSR (gray) and Glu-binding site in mGluR1 (cyan). Agonist-binding residues that are located at the same locations of the two receptor structures are highlighted. DOI: http://dx.doi.org/10.7554/eLife.13662.014
Figure 4—figure supplement 2.
Figure 4—figure supplement 2.. Endogenous ligand of CaSR.
(A) Active-state structure of CaSR ECD homodimer showing unexplained electron density at the interdomain crevice of each protomer when crystals of CaSR ECD were grown in the presence of 10 mM Ca2+ and absence of any additional L-amino acids. (B, C) Close-up view of the region surrounding the extra density. Mesh represents a 2Fo-Fc electron density map contoured at 1σ. DOI: http://dx.doi.org/10.7554/eLife.13662.015
Figure 5.
Figure 5.. Ca2+-binding sites.
(A) Active-state structure showing peaks in anomalous difference Fourier map (magenta mesh; 3σ contour level) that correspond to bound Ca2+ ions. Sites are labeled 1–4 or 1'-4' for each protomer. (B) Specific contacts between CaSR ECD and each bound Ca2+ ion within one protomer of the active structure. Anomalous difference Fourier map (magenta): sites 1–3, 6σ; site 4, 4.5σ. Fo-Fc difference map (blue): sites 1–3, 4.5σ; site 4, 2.5σ. Distances between Ca2+ and oxygen atoms (dashed lines) are within 3.0 Å. Dashed lines between water and protein atoms are hydrogen bonds. (C) Inactive-state structure showing peaks in anomalous difference Fourier map (magenta mesh; 3σ) at Ca2+-binding sites 2 and 2'. (D) Specific contacts between CaSR ECD and bound Ca2+ ion within one protomer of the inactive structure. Anomalous difference Fourier map (magenta): 5σ. Fo-Fc difference map (blue): 4.5σ. DOI: http://dx.doi.org/10.7554/eLife.13662.016
Figure 5—figure supplement 1.
Figure 5—figure supplement 1.. Ca2+-binding sites in the active homodimer.
(A) Active-state structure of CaSR ECD showing peaks in anomalous difference Fourier map (magenta mesh; 3σ contour level) that correspond to bound Ca2+ ions. Sites are labeled 1–4 or 1'-4' for each protomer. (B, C) Specific contacts between CaSR ECD and each bound Ca2+ ion within both protomers of the active structure. Anomalous difference Fourier map (magenta mesh): sites 1–3, 6σ; site 4, 4.5σ. Fo-Fc difference map (blue mesh): sites 1–3, 4.5σ; site 4, 2.5σ. The distances between Ca2+ and oxygen atoms (dashed lines) are within 3.0 Å. Dashed lines between water and protein atoms are hydrogen bonds. (D) Comparison of inactive (red) and active (blue) structures in the region of each Ca2+-binding site. DOI: http://dx.doi.org/10.7554/eLife.13662.017
Figure 6.
Figure 6.. Mutational analysis of Ca2+-binding sites.
(A, B) Dose-dependent Ca2+-stimulated IP accumulation (A) and intracellular Ca2+ mobilization (B) in cells transiently expressing wt or mutant CaSR. Naturally occurring inactivating mutations I81M and T100I are located at various Ca2+-binding sites. The single mutation N102I was designed based on structure to interfere with Ca2+-binding. DOI: http://dx.doi.org/10.7554/eLife.13662.018
Figure 7.
Figure 7.. Anion-binding sites.
(A) Inactive-state structure showing peaks in anomalous difference Fourier map (green mesh; 3σ) that correspond to bound SO42- ions. Sites are labeled 1–3 or 1'-3' for each protomer. (B) Specific contacts between CaSR ECD and each bound SO42- ion within one protomer of the inactive structure. Anomalous difference Fourier map (green): 3.5σ. Fo-Fc map (blue): 4σ. Dashed lines represent hydrogen bonds. (C) Active-state structure showing peaks in anomalous difference Fourier map (green mesh; 3σ) that correspond to bound PO43- ions. Sites are labeled 2 and 4 or 2' and 4' for each protomer. (D) Specific contacts between CaSR ECD and each bound PO43- ion within one protomer of the active structure. Anomalous difference Fourier map (green): 3.5σ. Fo-Fc map (blue): 4σ. (E) Active-state structure of CaSR ECD showing the additional hydrogen bonds formed across the interdomain cleft in the absence of any bound anion at sites 1 and 3 (left). Comparison of inactive (red) and active (light blue) structures in the region of anion binding sites 1 (center) and 3 (right). DOI: http://dx.doi.org/10.7554/eLife.13662.019
Figure 7—figure supplement 1.
Figure 7—figure supplement 1.. Anion-binding sites in the active homodimer.
(A) Active-state structure of CaSR ECD showing the peaks in anomalous difference Fourier map (3σ) that correspond to bound PO43- ions. The sites are labeled 2 and 4 or 2' and 4' for each protomer. (B, C) Specific contacts between CaSR ECD and each bound PO43- ion within both protomers of the active structure. Anomalous difference Fourier map (green): 3.5σ. Fo-Fc map (blue): 4σ. Dashed lines represent hydrogen bonds. DOI: http://dx.doi.org/10.7554/eLife.13662.020
Figure 8.
Figure 8.. Mutational analysis of anion-binding sites.
(A, B) Dose-dependent Ca2+-stimulated IP accumulation (A) and intracellular Ca2+ mobilization (B) in cells transiently expressing wt or mutant CaSR. Naturally-occurring inactivating mutations R66H, R69E, and S417L are located at anion-binding site 2 (or 2'). (C) Effect of SO42- ion on Ca2+-stimulated IP accumulation in cells transiently expressing wild-type CaSR. DOI: http://dx.doi.org/10.7554/eLife.13662.021
Figure 9.
Figure 9.. Activation mechanism of CaSR.
The schematic diagram shows the equilibrium between the resting and active states of CaSR and the effects of L-amino acid and Ca2+ binding. DOI: http://dx.doi.org/10.7554/eLife.13662.022
Author response image 1.
Author response image 1.. Effect of SO42- on Ca2+-stimulated IP accumulation in cells transiently expressing wild-type (WT) or mutant CaSR.
The mutations R62M and R66H affect arginine residues at anion-binding sites 1 and 3 that form hydrogen bonds formed across the interdomain cleft in the absence of any bound anion. DOI: http://dx.doi.org/10.7554/eLife.13662.023
Author response image 2.
Author response image 2.. Effect of various concentrations of L-Trp (1, 2, 0, 10 mM) on intracellular Ca2+ mobilization in the presence of 2 mM extracellular Ca2+.
(A) Wild-type (WT) CaSR. (B) S147A mutant. (C) Y218A mutant. DOI: http://dx.doi.org/10.7554/eLife.13662.024
Author response image 3.
Author response image 3.. Superposition of the CaSR and mGluR1 structures in the region of the Gd3+-binding site in mGluR1 structure.
DOI: http://dx.doi.org/10.7554/eLife.13662.025
Author response image 4.
Author response image 4.. Dose-dependent Ca2+-stimulated IP accumulation in cells transiently expressing the D234A mutant CaSR.
DOI: http://dx.doi.org/10.7554/eLife.13662.026

Similar articles

Cited by

References

    1. Adams PD, Afonine PV, Bunkóczi G, Chen VB, Davis IW, Echols N, Headd JJ, Hung LW, Kapral GJ, Grosse-Kunstleve RW, McCoy AJ, Moriarty NW, Oeffner R, Read RJ, Richardson DC, Richardson JS, Terwilliger TC, Zwart PH. PHENIX: a comprehensive Python-based system for macromolecular structure solution. Acta Crystallographica Section D Biological Crystallography. 2010;66:213–221. doi: 10.1107/S0907444909052925. - DOI - PMC - PubMed
    1. Bai M, Quinn S, Trivedi S, Kifor O, Pearce SH, Pollak MR, Krapcho K, Hebert SC, Brown EM. Expression and characterization of inactivating and activating mutations in the human Ca2+o-sensing receptor. Journal of Biological Chemistry. 1996;271:19537–19545. doi: 10.1074/jbc.271.32.19537. - DOI - PubMed
    1. Bai M, Trivedi S, Brown EM. Dimerization of the extracellular calcium-sensing receptor (CaR) on the cell surface of CaR-transfected HEK293 cells. Journal of Biological Chemistry. 1998;273:23605–23610. doi: 10.1074/jbc.273.36.23605. - DOI - PubMed
    1. Berger I, Fitzgerald DJ, Richmond TJ. Baculovirus expression system for heterologous multiprotein complexes. Nature Biotechnology. 2004;22:1583–1587. doi: 10.1038/nbt1036. - DOI - PubMed
    1. Bräuner-Osborne H, Jensen AA, Sheppard PO, O'Hara P, Krogsgaard-Larsen P. The agonist-binding domain of the calcium-sensing receptor is located at the amino-terminal domain. Journal of Biological Chemistry. 1999;274:18382–18386. doi: 10.1074/jbc.274.26.18382. - DOI - PubMed

Publication types