

EMT reversal in human cancer cells after IR knockdown in hyperinsulinemic mice
- PMID: 27435064
- PMCID: PMC4990486
- DOI: 10.1530/ERC-16-0142
EMT reversal in human cancer cells after IR knockdown in hyperinsulinemic mice
Abstract
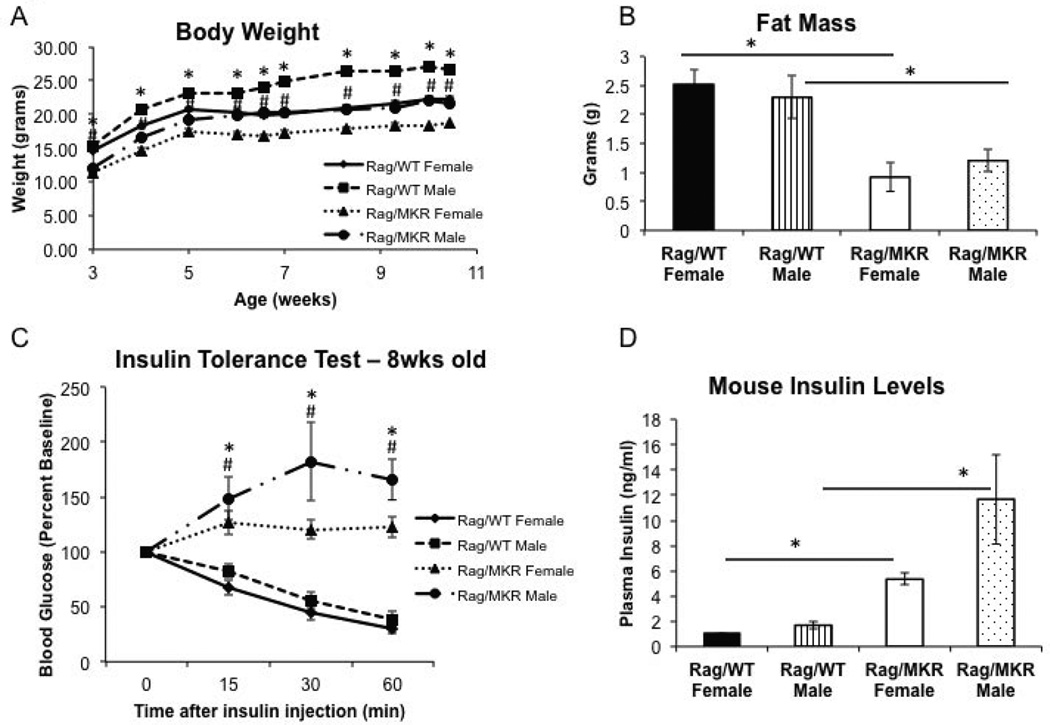
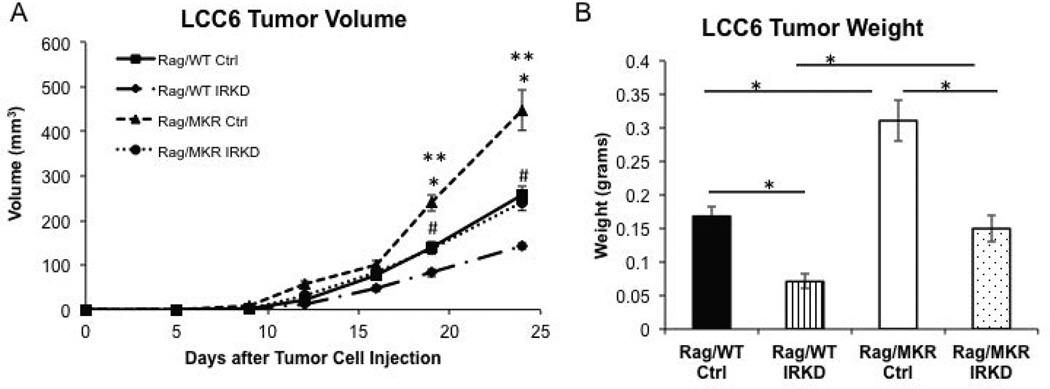
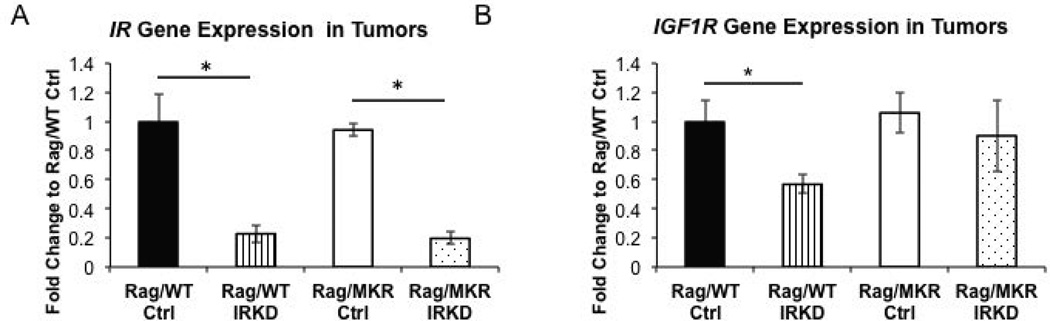
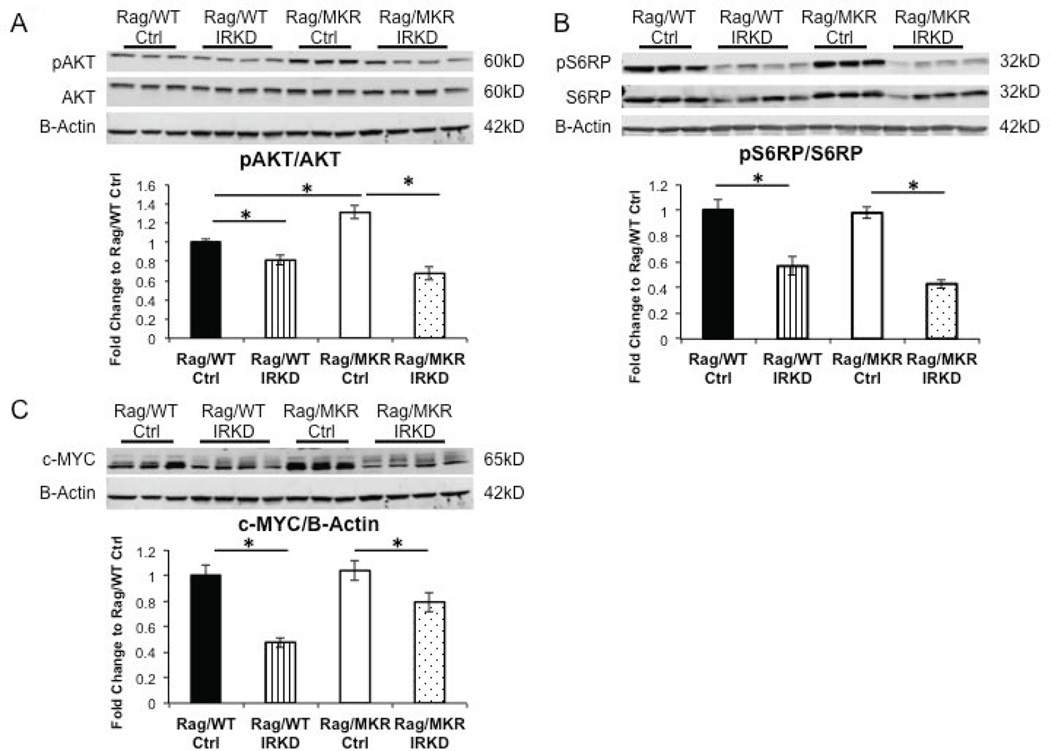
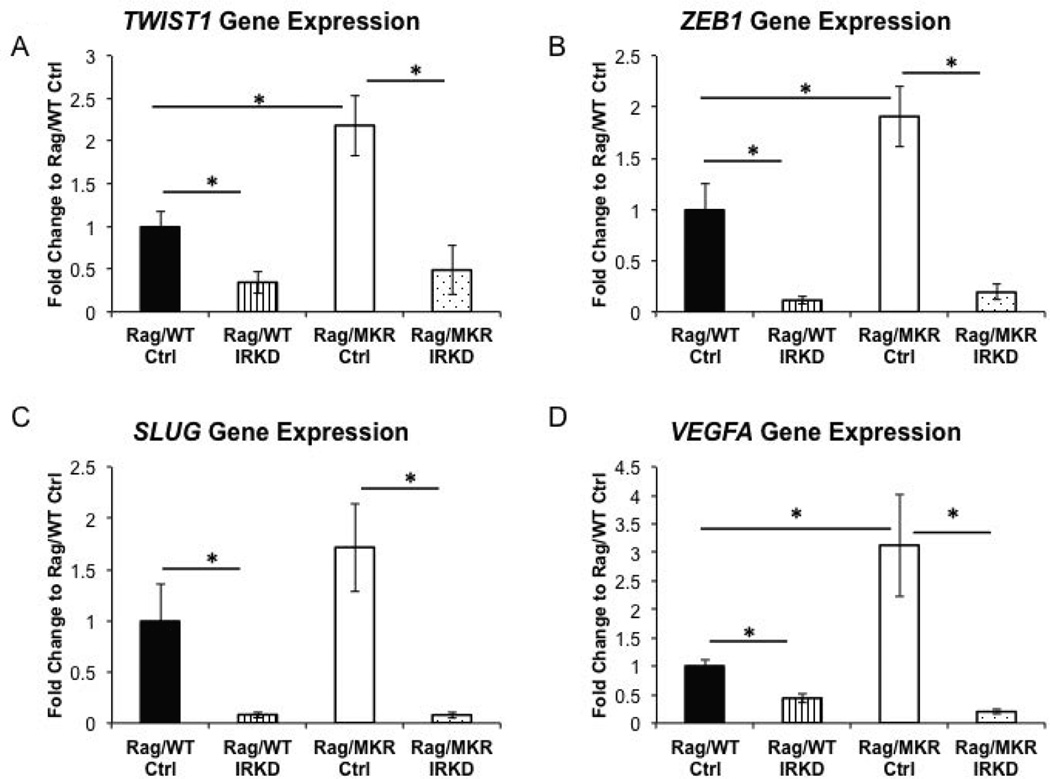
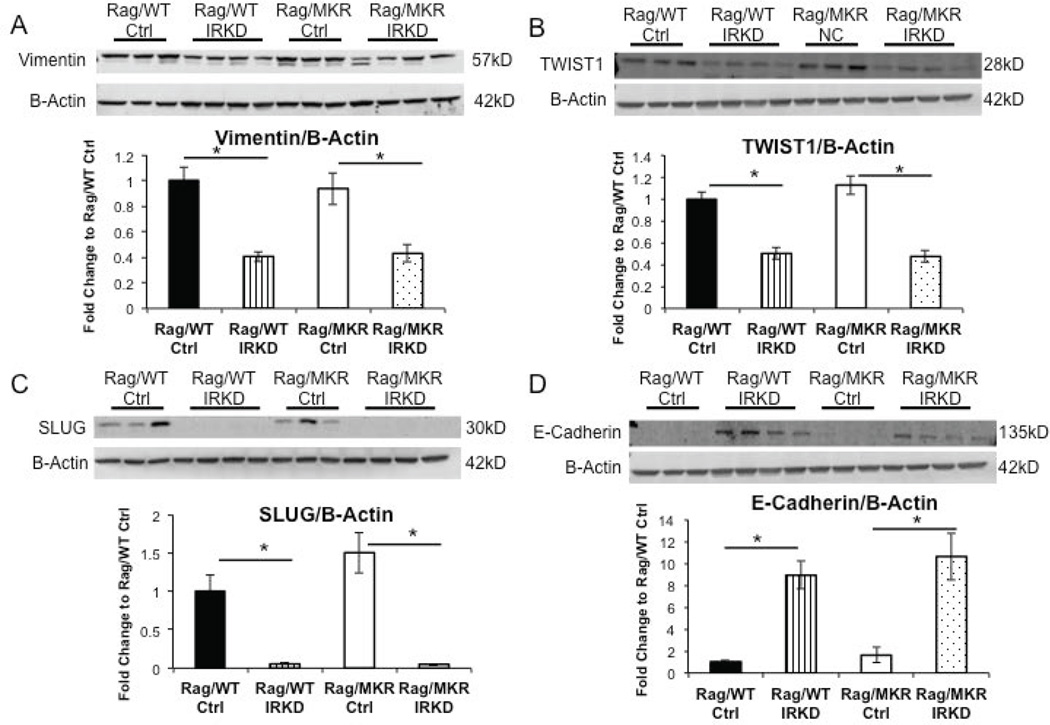
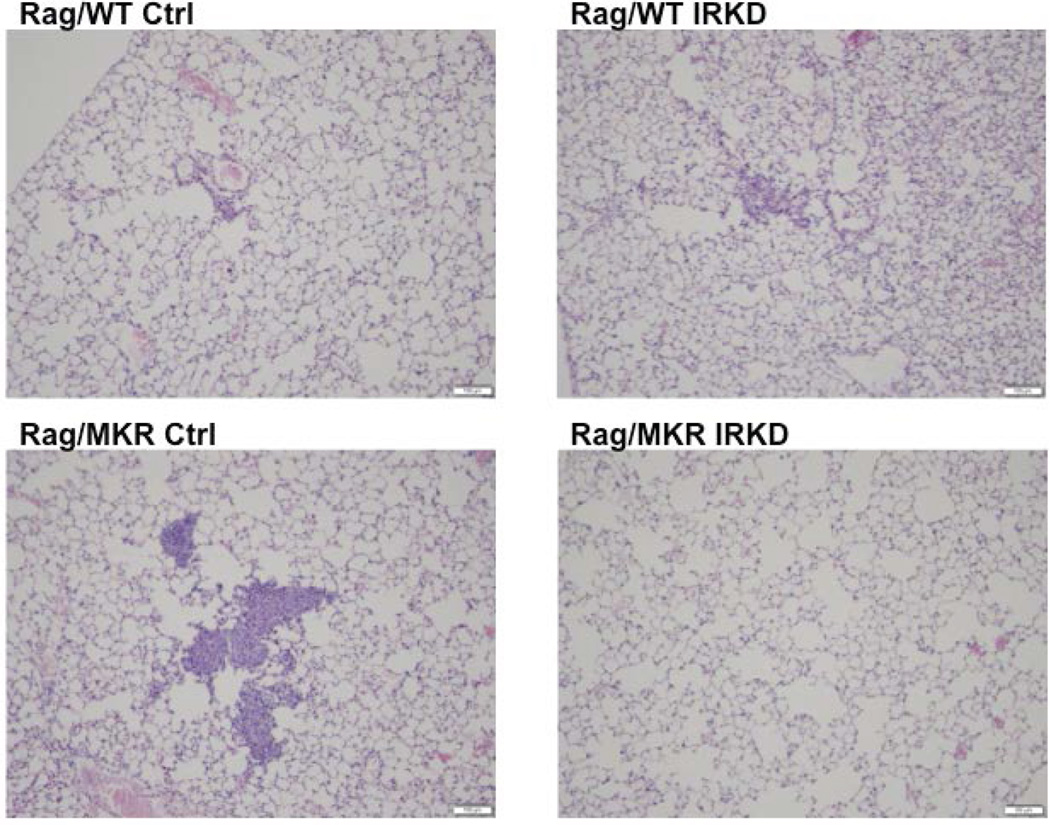
Type 2 diabetes (T2D) is associated with increased cancer risk and cancer-related mortality. Data herein show that we generated an immunodeficient hyperinsulinemic mouse by crossing the Rag1(-/-) mice, which have no mature B or T lymphocytes, with the MKR mouse model of T2D to generate the Rag1(-/-) (Rag/WT) and Rag1(-/-)/MKR(+/+) (Rag/MKR) mice. The female Rag/MKR mice are insulin resistant and have significantly higher nonfasting plasma insulin levels compared with the Rag/WT controls. Therefore, we used these Rag/MKR mice to investigate the role of endogenous hyperinsulinemia on human cancer progression. In this study, we show that hyperinsulinemia in the Rag/MKR mice increases the expression of mesenchymal transcription factors, TWIST1 and ZEB1, and increases the expression of the angiogenesis marker, vascular endothelial growth factor A (VEGFA). We also show that silencing the insulin receptor (IR) in the human LCC6 cancer cells leads to decreased tumor growth and metastases, suppression of mesenchymal markers vimentin, SLUG, TWIST1 and ZEB1, suppression of angiogenesis markers, VEGFA and VEGFD, and re-expression of the epithelial marker, E-cadherin. The data in this paper demonstrate that IR knockdown in primary tumors partially reverses the growth-promoting effects of hyperinsulinemia as well as highlighting the importance of the insulin receptor signaling pathway in cancer progression, and more specifically in epithelial-mesenchymal transition.
Keywords: cancer; epithelial–mesenchymal transition; hyperinsulinemia; insulin receptor; type 2 diabetes.
© 2016 Society for Endocrinology.
Conflict of interest statement
Declaration of Interest The authors disclose no potential conflicts of interest.
Figures
Similar articles
-
Hyperinsulinemia enhances c-Myc-mediated mammary tumor development and advances metastatic progression to the lung in a mouse model of type 2 diabetes.Breast Cancer Res. 2012 Jan 7;14(1):R8. doi: 10.1186/bcr3089. Breast Cancer Res. 2012. PMID: 22226054 Free PMC article.
-
Silencing vimentin expression decreases pulmonary metastases in a pre-diabetic mouse model of mammary tumor progression.Oncogene. 2017 Mar;36(10):1394-1403. doi: 10.1038/onc.2016.305. Epub 2016 Aug 29. Oncogene. 2017. PMID: 27568979 Free PMC article.
-
Keratin 13 gene is epigenetically suppressed during transforming growth factor-β1-induced epithelial-mesenchymal transition in a human keratinocyte cell line.Biochem Biophys Res Commun. 2018 Feb 5;496(2):381-386. doi: 10.1016/j.bbrc.2018.01.047. Epub 2018 Jan 8. Biochem Biophys Res Commun. 2018. PMID: 29326042
-
AKT-ions with a TWIST between EMT and MET.Oncotarget. 2016 Sep 20;7(38):62767-62777. doi: 10.18632/oncotarget.11232. Oncotarget. 2016. PMID: 27623213 Free PMC article. Review.
-
Emerging role of Twist1 in fibrotic diseases.J Cell Mol Med. 2018 Mar;22(3):1383-1391. doi: 10.1111/jcmm.13465. Epub 2018 Jan 5. J Cell Mol Med. 2018. PMID: 29314610 Free PMC article. Review.
Cited by
-
Hyperinsulinemia promotes aberrant histone acetylation in triple-negative breast cancer.Epigenetics Chromatin. 2019 Jul 17;12(1):44. doi: 10.1186/s13072-019-0290-9. Epigenetics Chromatin. 2019. PMID: 31315653 Free PMC article.
-
Discoidin domain receptor 1 modulates insulin receptor signaling and biological responses in breast cancer cells.Oncotarget. 2017 Jun 27;8(26):43248-43270. doi: 10.18632/oncotarget.18020. Oncotarget. 2017. PMID: 28591735 Free PMC article.
-
Hyperinsulinaemia in cancer.Nat Rev Cancer. 2020 Nov;20(11):629-644. doi: 10.1038/s41568-020-0295-5. Epub 2020 Sep 9. Nat Rev Cancer. 2020. PMID: 32908223 Review.
-
Network Pharmacology Study to Reveal the Potentiality of a Methanol Extract of Caesalpinia sappan L. Wood against Type-2 Diabetes Mellitus.Life (Basel). 2022 Feb 13;12(2):277. doi: 10.3390/life12020277. Life (Basel). 2022. PMID: 35207564 Free PMC article.
-
Identification of two microRNA nodes as potential cooperative modulators of liver metabolism.Hepatol Res. 2019 Dec;49(12):1451-1465. doi: 10.1111/hepr.13419. Epub 2019 Sep 11. Hepatol Res. 2019. PMID: 31408567 Free PMC article.
References
-
- Al Moustafa AE, Achkhar A, Yasmeen A. EGF-receptor signaling and epithelial-mesenchymal transition in human carcinomas. Front Biosci (Schol Ed) 2012;4:671–684. - PubMed
-
- Calvo A, Catena R, Noble MS, Carbott D, Gil-Bazo I, Gonzalez-Moreno O, Huh JI, Sharp R, Qiu TH, Anver MR, et al. Identification of VEGF-regulated genes associated with increased lung metastatic potential: functional involvement of tenascin-C in tumor growth and lung metastasis. Oncogene. 2008;27:5373–5384. - PMC - PubMed
-
- Chambers AF. MDA-MB-435 and M14 cell lines: identical but not M14 melanoma? Cancer Res. 2009;69:5292–5293. - PubMed
Publication types
MeSH terms
Substances
Grants and funding
LinkOut - more resources
Full Text Sources
Other Literature Sources
Research Materials
