

Association of the molecular regulation of ear leaf senescence/stress response and photosynthesis/metabolism with heterosis at the reproductive stage in maize
- PMID: 27435114
- PMCID: PMC4951735
- DOI: 10.1038/srep29843
Association of the molecular regulation of ear leaf senescence/stress response and photosynthesis/metabolism with heterosis at the reproductive stage in maize
Abstract
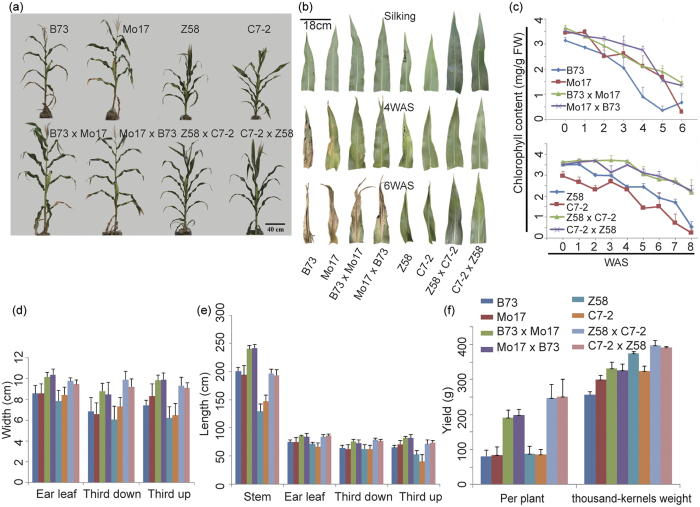
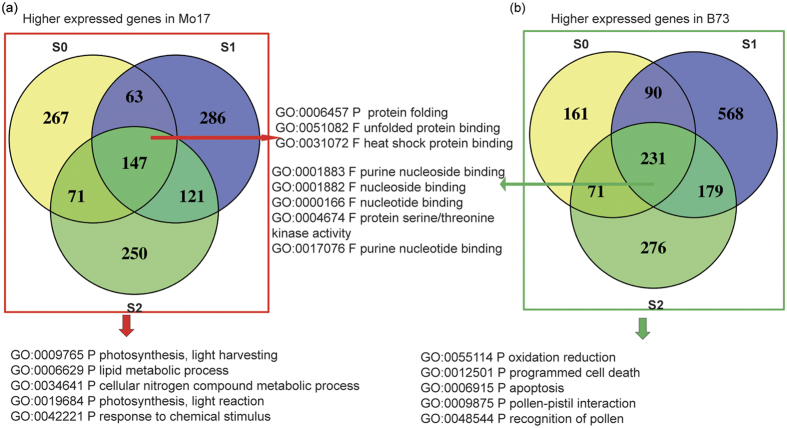
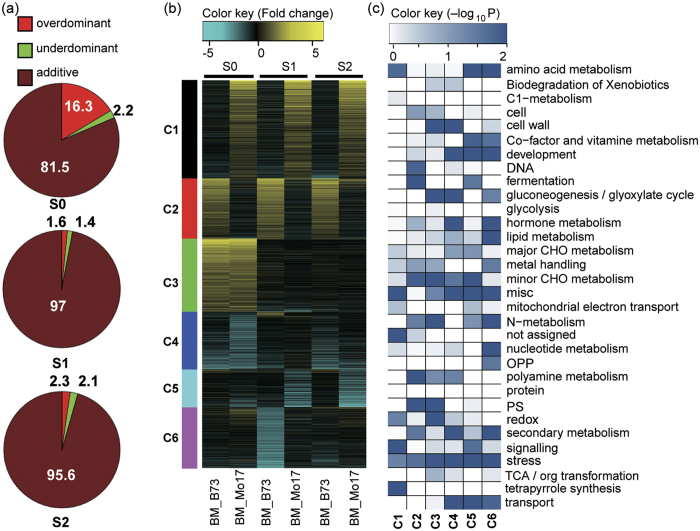
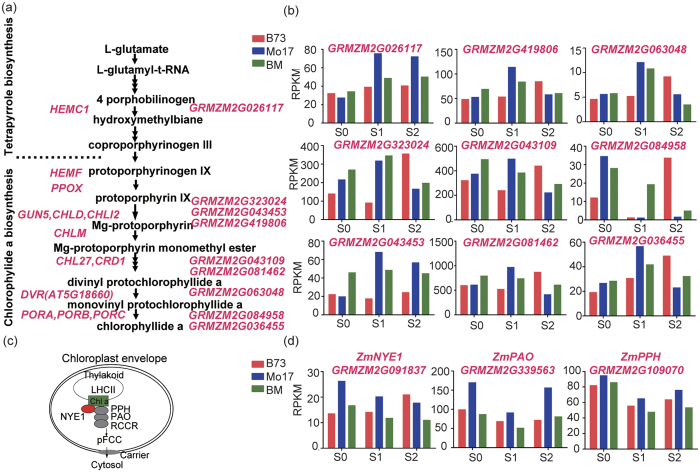
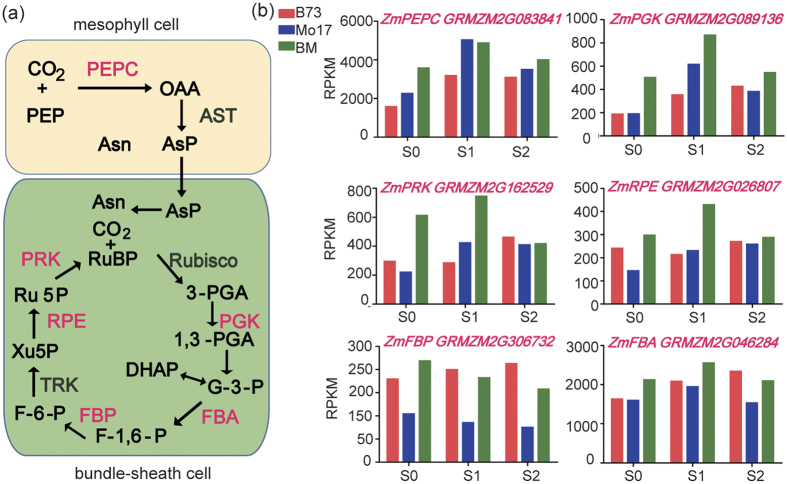
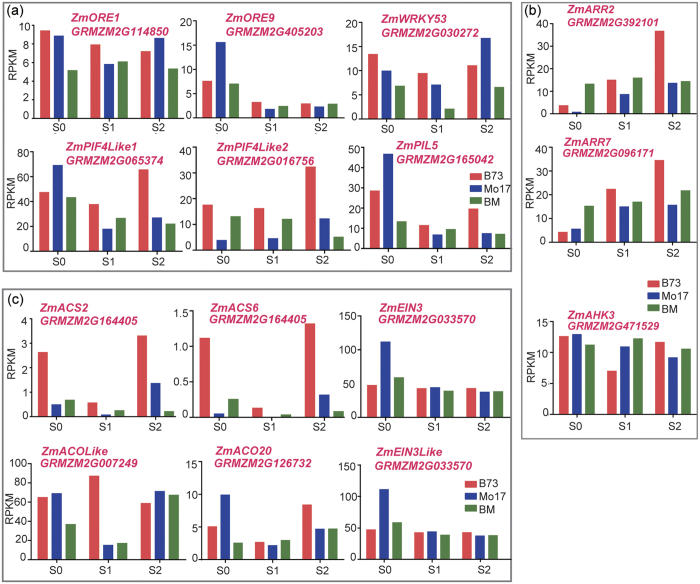
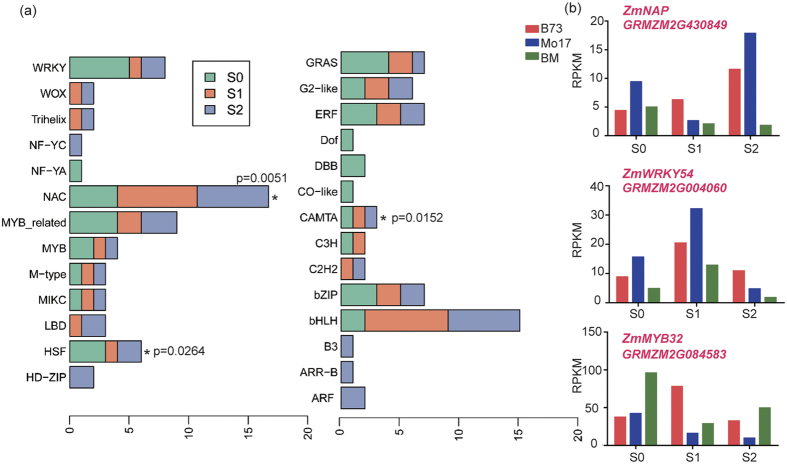
Maize exhibits a wide range of heterotic traits, but the molecular basis of heterosis at the reproductive stage has seldom been exploited. Leaf senescence is a degenerative process which affects crop yield and quality. In this study, we observed significantly delayed ear leaf senescence in the reciprocal hybrids of B73/Mo17 and Zheng58/Chang7-2 after silking, and all the hybrids displayed larger leaf areas and higher stems with higher yields. Our time-course transcriptome analysis identified 2,826 differentially expressed genes (DEGs) between two parental lines (PP-DEGs) and 2,328 DEGs between parental lines and the hybrid (PH-DEGs) after silking. Notably, several senescence promoting genes (ZmNYE1, ZmORE1, ZmWRKY53 and ZmPIFs) exhibited underdominant expression patterns in the hybrid, whereas putative photosynthesis and carbon-fixation (ZmPEPC)-associated, starch biosynthetic (ZmAPS1, ZmAPL), gibberellin biosynthetic genes (ZmGA20OX, ZmGA3OX) expressed overdominantly. We also identified 86 transcription factors from PH-DEGs, some of which were known to regulate senescence, stress and metabolic processes. Collectively, we demonstrate a molecular association of the regulations of both ear leaf senescence/stress response and photosynthesis/metabolism with heterosis at the late developmental stage. This finding not only extends our understanding to the molecular basis of maize heterosis but also provides basic information for molecular breeding.
Figures
Similar articles
-
Comparative transcriptomic analysis of maize ear heterosis during the inflorescence meristem differentiation stage.BMC Plant Biol. 2022 Jul 18;22(1):348. doi: 10.1186/s12870-022-03695-6. BMC Plant Biol. 2022. PMID: 35843937 Free PMC article.
-
Identification and characterization of a repertoire of genes differentially expressed in developing top ear shoots between a superior hybrid and its parental inbreds in Zea mays L.Mol Genet Genomics. 2013 Dec;288(12):691-705. doi: 10.1007/s00438-013-0781-5. Epub 2013 Oct 22. Mol Genet Genomics. 2013. PMID: 24146224
-
Heterosis in early maize ear inflorescence development: a genome-wide transcription analysis for two maize inbred lines and their hybrid.Int J Mol Sci. 2014 Aug 11;15(8):13892-915. doi: 10.3390/ijms150813892. Int J Mol Sci. 2014. PMID: 25116687 Free PMC article.
-
Epigenetic Changes in Hybrids.Plant Physiol. 2015 Aug;168(4):1197-205. doi: 10.1104/pp.15.00231. Epub 2015 May 22. Plant Physiol. 2015. PMID: 26002907 Free PMC article. Review.
-
Molecular dissection of heterosis in cereal roots and their rhizosphere.Theor Appl Genet. 2023 Jul 20;136(8):173. doi: 10.1007/s00122-023-04419-6. Theor Appl Genet. 2023. PMID: 37474870 Free PMC article. Review.
Cited by
-
Plant height heterosis is quantitatively associated with expression levels of plastid ribosomal proteins.Proc Natl Acad Sci U S A. 2021 Nov 23;118(47):e2109332118. doi: 10.1073/pnas.2109332118. Proc Natl Acad Sci U S A. 2021. PMID: 34782463 Free PMC article.
-
Improving Yield and Yield Stability in Winter Rye by Hybrid Breeding.Plants (Basel). 2022 Oct 10;11(19):2666. doi: 10.3390/plants11192666. Plants (Basel). 2022. PMID: 36235531 Free PMC article. Review.
-
Comprehensive transcriptome analysis provides molecular insights into the heterosis-associated drought tolerance and reveals ZmbHLH137 that promotes drought tolerance in maize seedlings.Front Plant Sci. 2025 May 23;16:1565650. doi: 10.3389/fpls.2025.1565650. eCollection 2025. Front Plant Sci. 2025. PMID: 40487216 Free PMC article.
-
Transcriptome Analysis of Maize Ear Leaves Treated with Long-Term Straw Return plus Nitrogen Fertilizer under the Wheat-Maize Rotation System.Plants (Basel). 2023 Nov 16;12(22):3868. doi: 10.3390/plants12223868. Plants (Basel). 2023. PMID: 38005765 Free PMC article.
-
Silage maize as a potent candidate for sustainable animal husbandry development-perspectives and strategies for genetic enhancement.Front Genet. 2023 May 26;14:1150132. doi: 10.3389/fgene.2023.1150132. eCollection 2023. Front Genet. 2023. PMID: 37303948 Free PMC article. Review.
References
-
- Schnable P. S. & Springer N. M. Progress toward understanding heterosis in crop plants. Annu. Rev. Plant Biol. 64, 71–88 (2013). - PubMed
-
- Lee E. & Tollenaar M. Physiological basis of successful breeding strategies for maize grain yield. Crop Sci. 47, S-202–S-215 (2007).
-
- Davenport C. B. Degeneration, Albinism and Inbreeding. Science 28, 454–455 (1908). - PubMed
Publication types
MeSH terms
Substances
LinkOut - more resources
Full Text Sources
Other Literature Sources
Miscellaneous
