

Targeted genomic analysis reveals widespread autoimmune disease association with regulatory variants in the TNF superfamily cytokine signalling network
- PMID: 27435189
- PMCID: PMC4952362
- DOI: 10.1186/s13073-016-0329-5
Targeted genomic analysis reveals widespread autoimmune disease association with regulatory variants in the TNF superfamily cytokine signalling network
Abstract
Background: Tumour necrosis factor (TNF) superfamily cytokines and their receptors regulate diverse immune system functions through a common set of signalling pathways. Genetic variants in and expression of individual TNF superfamily cytokines, receptors and signalling proteins have been associated with autoimmune and inflammatory diseases, but their interconnected biology has been largely unexplored.
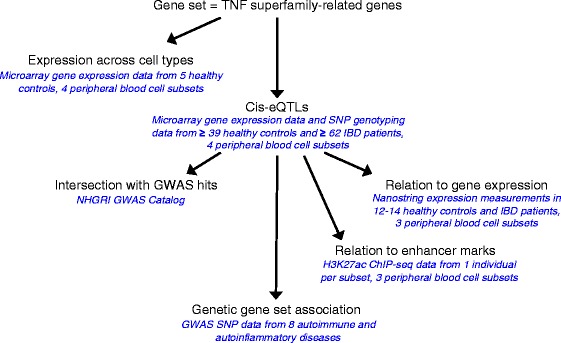
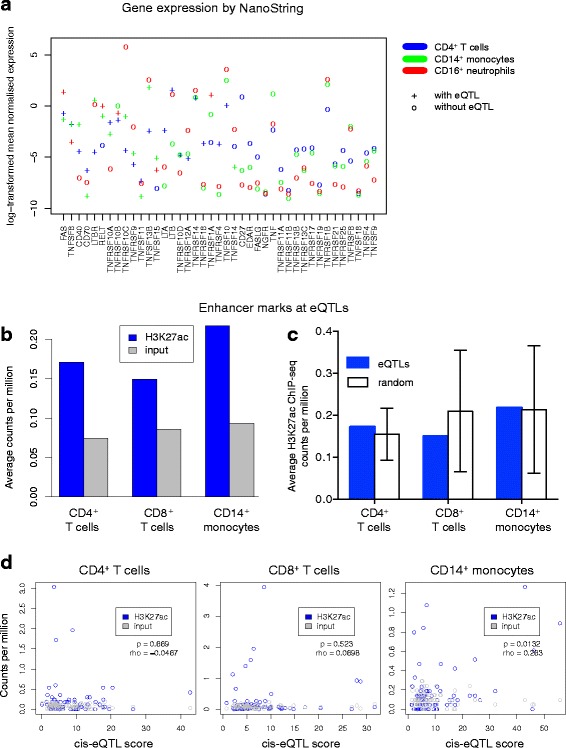
Methods: We took a hypothesis-driven approach using available genome-wide datasets to identify genetic variants regulating gene expression in the TNF superfamily cytokine signalling network and the association of these variants with autoimmune and autoinflammatory disease. Using paired gene expression and genetic data, we identified genetic variants associated with gene expression, expression quantitative trait loci (eQTLs), in four peripheral blood cell subsets. We then examined whether eQTLs were dependent on gene expression level or the presence of active enhancer chromatin marks. Using these eQTLs as genetic markers of the TNF superfamily signalling network, we performed targeted gene set association analysis in eight autoimmune and autoinflammatory disease genome-wide association studies.
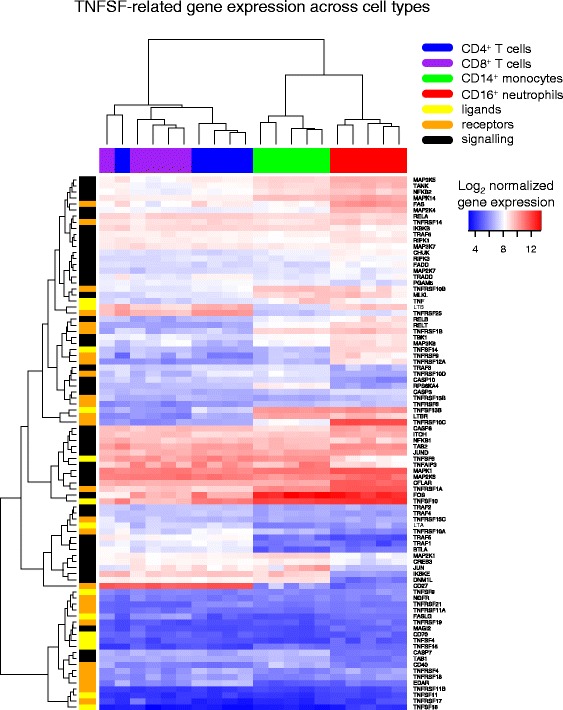
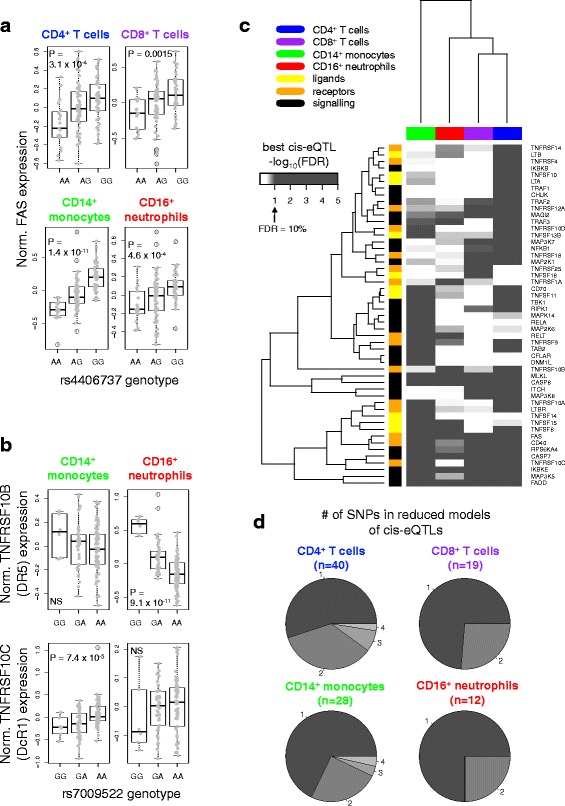
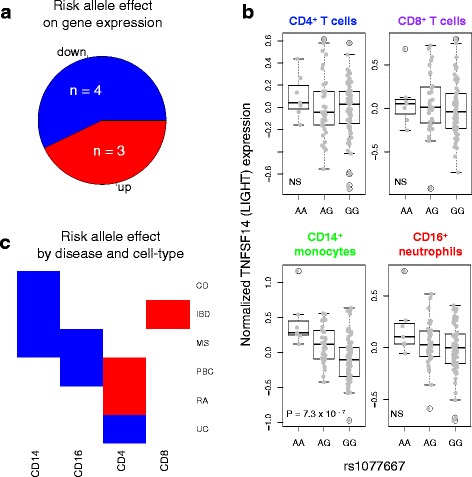
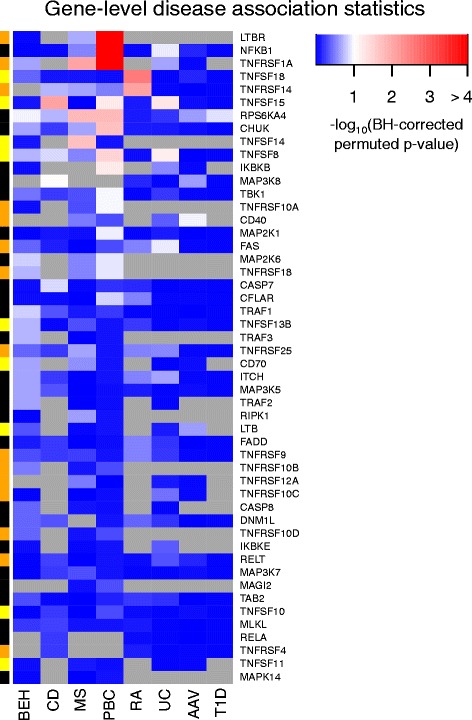
Results: Comparison of TNF superfamily network gene expression and regulatory variants across four leucocyte subsets revealed patterns that differed between cell types. eQTLs for genes in this network were not dependent on absolute gene expression levels and were not enriched for chromatin marks of active enhancers. By examining autoimmune disease risk variants among our eQTLs, we found that risk alleles can be associated with either increased or decreased expression of co-stimulatory TNF superfamily cytokines, receptors or downstream signalling molecules. Gene set disease association analysis revealed that eQTLs for genes in the TNF superfamily pathway were associated with six of the eight autoimmune and autoinflammatory diseases examined, demonstrating associations beyond single genome-wide significant hits.
Conclusions: This systematic analysis of the influence of regulatory genetic variants in the TNF superfamily network reveals widespread and diverse roles for these cytokines in susceptibility to a number of immune-mediated diseases.
Keywords: Autoimmunity; Autoinflammation; GWAS; Gene set analysis; Genetics; Genomics; TNF superfamily; eQTL.
Figures
Similar articles
-
Limited statistical evidence for shared genetic effects of eQTLs and autoimmune-disease-associated loci in three major immune-cell types.Nat Genet. 2017 Apr;49(4):600-605. doi: 10.1038/ng.3795. Epub 2017 Feb 20. Nat Genet. 2017. PMID: 28218759 Free PMC article.
-
Cell-type-specific meQTLs extend melanoma GWAS annotation beyond eQTLs and inform melanocyte gene-regulatory mechanisms.Am J Hum Genet. 2021 Sep 2;108(9):1631-1646. doi: 10.1016/j.ajhg.2021.06.018. Epub 2021 Jul 21. Am J Hum Genet. 2021. PMID: 34293285 Free PMC article.
-
Identification of genetic variants that impact gene co-expression relationships using large-scale single-cell data.Genome Biol. 2023 Apr 18;24(1):80. doi: 10.1186/s13059-023-02897-x. Genome Biol. 2023. PMID: 37072791 Free PMC article.
-
Genetics of autoimmune diseases: perspectives from genome-wide association studies.Int Immunol. 2016 Apr;28(4):155-61. doi: 10.1093/intimm/dxw002. Epub 2016 Feb 8. Int Immunol. 2016. PMID: 26857735 Free PMC article. Review.
-
Cytokine gene polymorphisms and human autoimmune disease in the era of genome-wide association studies.J Interferon Cytokine Res. 2012 Apr;32(4):139-51. doi: 10.1089/jir.2011.0103. Epub 2011 Dec 22. J Interferon Cytokine Res. 2012. PMID: 22191464 Free PMC article. Review.
Cited by
-
Type 3 innate lymphoid cell-derived lymphotoxin prevents microbiota-dependent inflammation.Cell Mol Immunol. 2018 Jul;15(7):697-709. doi: 10.1038/cmi.2017.25. Epub 2017 Jun 5. Cell Mol Immunol. 2018. PMID: 28579615 Free PMC article.
-
Gene regulatory network integration with multi-omics data enhances survival predictions in cancer.Brief Bioinform. 2025 Jul 2;26(4):bbaf315. doi: 10.1093/bib/bbaf315. Brief Bioinform. 2025. PMID: 40619810 Free PMC article.
-
TNF Superfamily and ILC2 Activation in Asthma.Biomolecules. 2024 Feb 29;14(3):294. doi: 10.3390/biom14030294. Biomolecules. 2024. PMID: 38540714 Free PMC article. Review.
-
Potential Molecular Mechanism of TNF Superfamily-Related Genes in Glioblastoma Multiforme Based on Transcriptome and Epigenome.Front Neurol. 2021 Feb 11;12:576382. doi: 10.3389/fneur.2021.576382. eCollection 2021. Front Neurol. 2021. PMID: 33643183 Free PMC article.
-
Low-dose IL-2 reduces IL-21+ T cell frequency and induces anti-inflammatory gene expression in type 1 diabetes.Nat Commun. 2022 Nov 28;13(1):7324. doi: 10.1038/s41467-022-34162-3. Nat Commun. 2022. PMID: 36443294 Free PMC article.
References
Publication types
MeSH terms
Substances
Grants and funding
LinkOut - more resources
Full Text Sources
Other Literature Sources
Medical
