

Comparison of 4D flow and 2D velocity-encoded phase contrast MRI sequences for the evaluation of aortic hemodynamics
- PMID: 27435230
- PMCID: PMC5096729
- DOI: 10.1007/s10554-016-0938-5
Comparison of 4D flow and 2D velocity-encoded phase contrast MRI sequences for the evaluation of aortic hemodynamics
Abstract
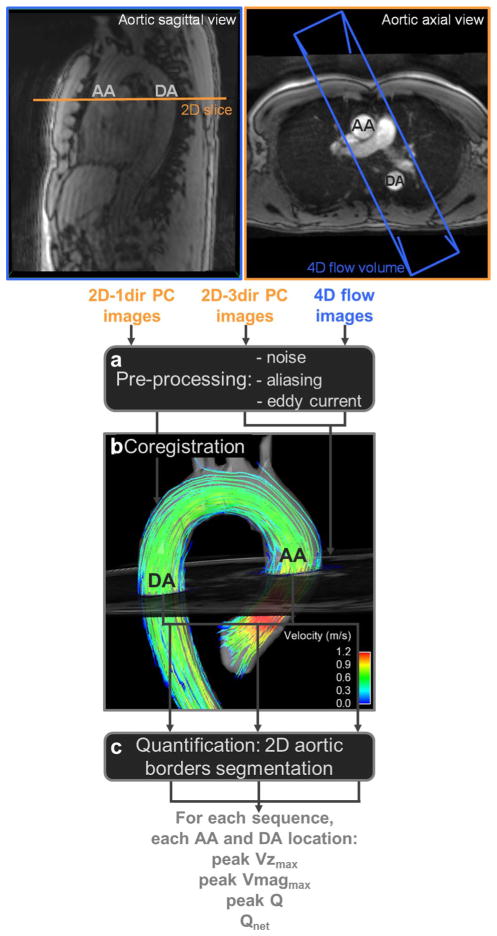
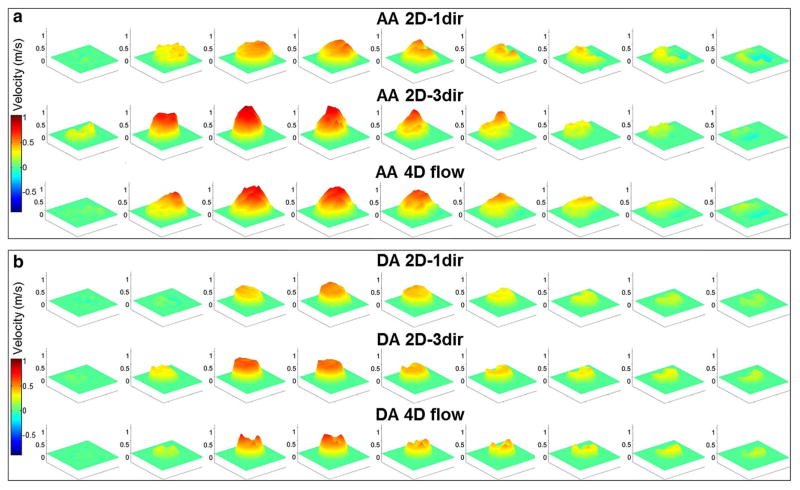
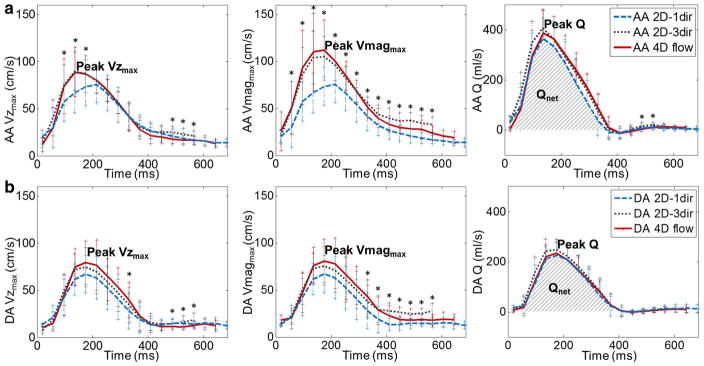
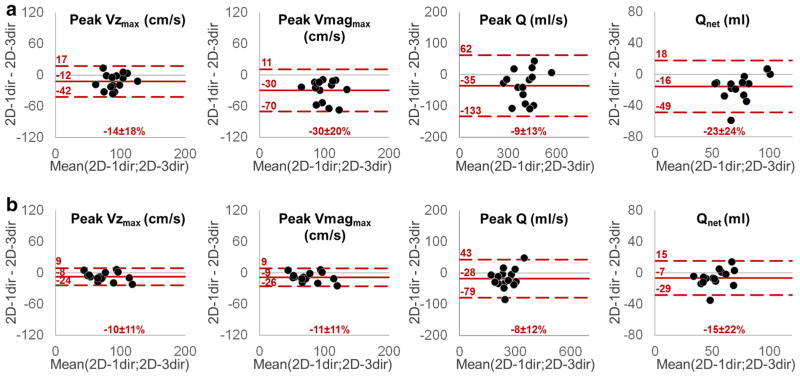
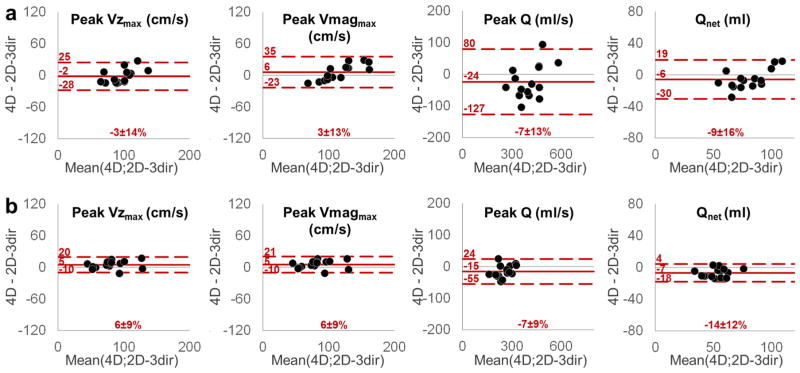
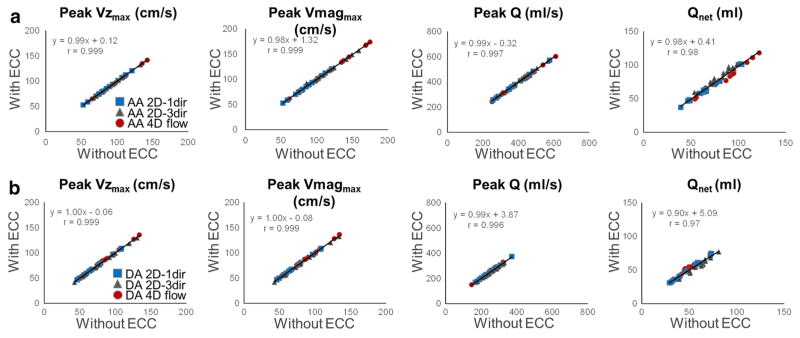
The purpose of this study was to compare aortic flow and velocity quantification using 4D flow MRI and 2D CINE phase-contrast (PC)-MRI with either one-directional (2D-1dir) or three-directional (2D-3dir) velocity encoding. 15 healthy volunteers (51 ± 19 years) underwent MRI including (1) breath-holding 2D-1dir and (2) free breathing 2D-3dir PC-MRI in planes orthogonal to the ascending (AA) and descending (DA) aorta, as well as (3) free breathing 4D flow MRI with full thoracic aorta coverage. Flow quantification included the co-registration of the 2D PC acquisition planes with 4D flow MRI data, AA and DA segmentation, and calculation of AA and DA peak systolic velocity, peak flow and net flow volume for all sequences. Additionally, the 2D-3dir velocity taking into account the through-plane component only was used to obtain results analogous to a free breathing 2D-1dir acquisition. Good agreement was found between 4D flow and 2D-3dir peak velocity (differences = -3 to 6 %), peak flow (-7 %) and net volume (-14 to -9 %). In contrast, breath-holding 2D-1dir measurements exhibited indices significantly lower than free breathing 2D-3dir and 2D-1dir (differences = -35 to -7 %, p < 0.05). Finally, high correlations (r ≥ 0.97) were obtained for indices estimated with or without eddy current correction, with the lowest correlation observed for net volume. 4D flow and 2D-3dir aortic hemodynamic indices were in concordance. However, differences between respiration state and 2D-1dir and 2D-3dir measurements indicate that reference values should be established according to the PC-MRI sequence, especially for the widely used net flow (e.g. stroke volume in the AA).
Keywords: 4D flow MRI; Aortic hemodynamics; MRI; Phase-contrast.
Conflict of interest statement
None.
Figures
Similar articles
-
Peak velocity measurements in tortuous arteries with phase contrast magnetic resonance imaging: the effect of multidirectional velocity encoding.Invest Radiol. 2014 Apr;49(4):189-94. doi: 10.1097/RLI.0000000000000013. Invest Radiol. 2014. PMID: 24300842
-
Quantification of aortic stenosis diagnostic parameters: comparison of fast 3 direction and 1 direction phase contrast CMR and transthoracic echocardiography.J Cardiovasc Magn Reson. 2017 Mar 7;19(1):35. doi: 10.1186/s12968-017-0339-5. J Cardiovasc Magn Reson. 2017. PMID: 28270219 Free PMC article.
-
Combined free-running four-dimensional anatomical and flow magnetic resonance imaging with native contrast using Synchronization of Neighboring Acquisitions by Physiological Signals.J Cardiovasc Magn Reson. 2024 Summer;26(1):101006. doi: 10.1016/j.jocmr.2024.101006. Epub 2024 Feb 2. J Cardiovasc Magn Reson. 2024. PMID: 38309581 Free PMC article.
-
Quantification of peak blood flow velocity at the cardiac valve and great thoracic vessels by four-dimensional flow and two-dimensional phase-contrast MRI compared with echocardiography: a systematic review and meta-analysis.Clin Radiol. 2021 Nov;76(11):863.e1-863.e10. doi: 10.1016/j.crad.2021.07.011. Epub 2021 Aug 14. Clin Radiol. 2021. PMID: 34404516
-
4D flow MRI.J Magn Reson Imaging. 2012 Nov;36(5):1015-36. doi: 10.1002/jmri.23632. J Magn Reson Imaging. 2012. PMID: 23090914 Review.
Cited by
-
Cardiac magnetic resonance systematically overestimates mitral regurgitations by the indirect method.Open Heart. 2020 Jul;7(2):e001323. doi: 10.1136/openhrt-2020-001323. Open Heart. 2020. PMID: 32675299 Free PMC article.
-
Patient-Specific Inverse Modeling of In Vivo Cardiovascular Mechanics with Medical Image-Derived Kinematics as Input Data: Concepts, Methods, and Applications.Appl Sci (Basel). 2022 Apr 2;12(8):3954. doi: 10.3390/app12083954. Epub 2022 Apr 14. Appl Sci (Basel). 2022. PMID: 36911244 Free PMC article.
-
A Clinical Approach to Multimodality Imaging in Pulmonary Hypertension.Front Cardiovasc Med. 2022 Jan 18;8:794706. doi: 10.3389/fcvm.2021.794706. eCollection 2021. Front Cardiovasc Med. 2022. PMID: 35118142 Free PMC article. Review.
-
Validation of 4D flow CMR against simultaneous invasive hemodynamic measurements: a swine study.Int J Cardiovasc Imaging. 2019 Jun;35(6):1111-1118. doi: 10.1007/s10554-019-01593-x. Epub 2019 Apr 8. Int J Cardiovasc Imaging. 2019. PMID: 30963352 Free PMC article.
-
Hemodynamic evaluation using four-dimensional flow magnetic resonance imaging for a patient with multichanneled aortic dissection.J Vasc Surg Cases Innov Tech. 2018 Mar 1;4(1):67-71. doi: 10.1016/j.jvscit.2017.11.005. eCollection 2018 Mar. J Vasc Surg Cases Innov Tech. 2018. PMID: 29725666 Free PMC article.
References
-
- Chai P, Mohiaddin R. How we perform cardiovascular magnetic resonance flow assessment using phase-contrast velocity mapping. J Cardiovasc Magn Reson. 2005;7(4):705–716. - PubMed
-
- Mohiaddin RH, Yang GZ, Kilner PJ. Visualization of flow by vector analysis of multidirectional cine MR velocity mapping. J Comput Assist Tomogr. 1994;18(3):383–392. - PubMed
Publication types
MeSH terms
Grants and funding
LinkOut - more resources
Full Text Sources
Other Literature Sources
Medical
