. 2016 Sep;26(9):1188-201.
doi: 10.1101/gr.201624.115. Epub 2016 Jul 19.

SMARCA4 regulates gene expression and higher-order chromatin structure in proliferating mammary epithelial cells

Affiliations

SMARCA4 regulates gene expression and higher-order chromatin structure in proliferating mammary epithelial cells

A Rasim Barutcu et al. Genome Res. 2016 Sep.

Abstract

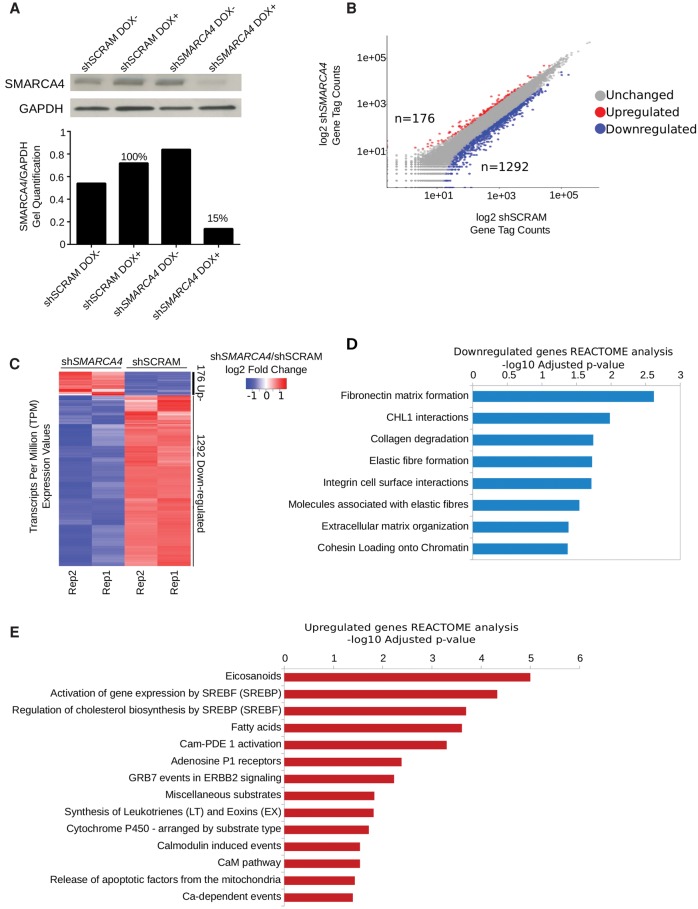
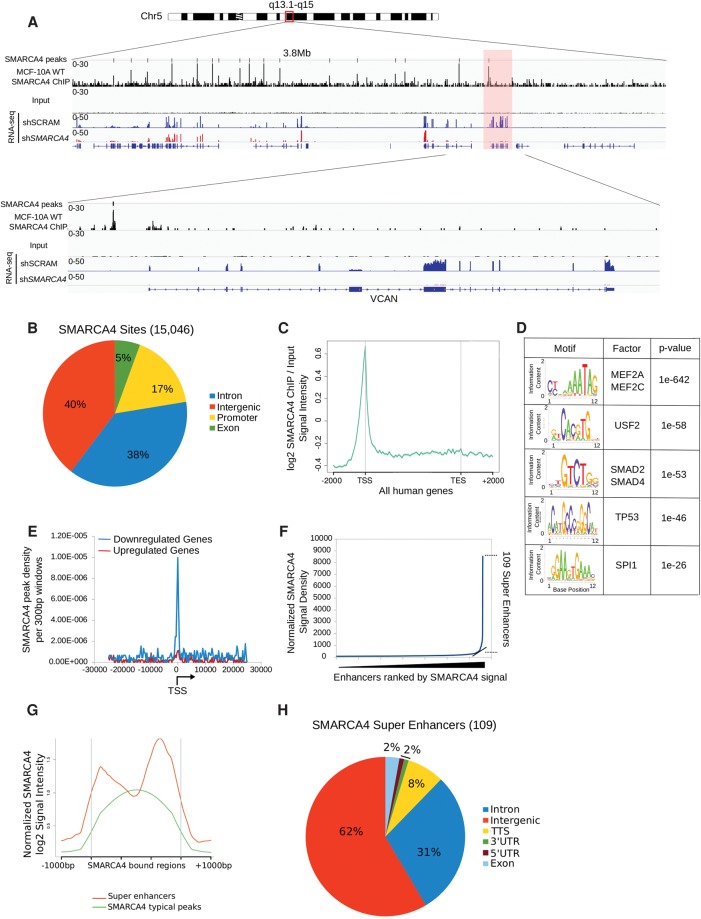
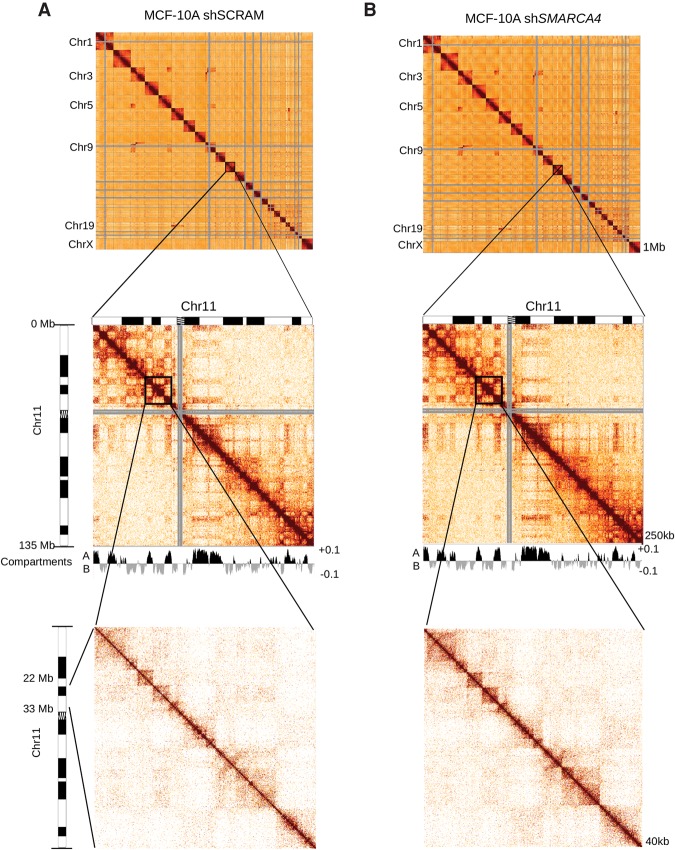
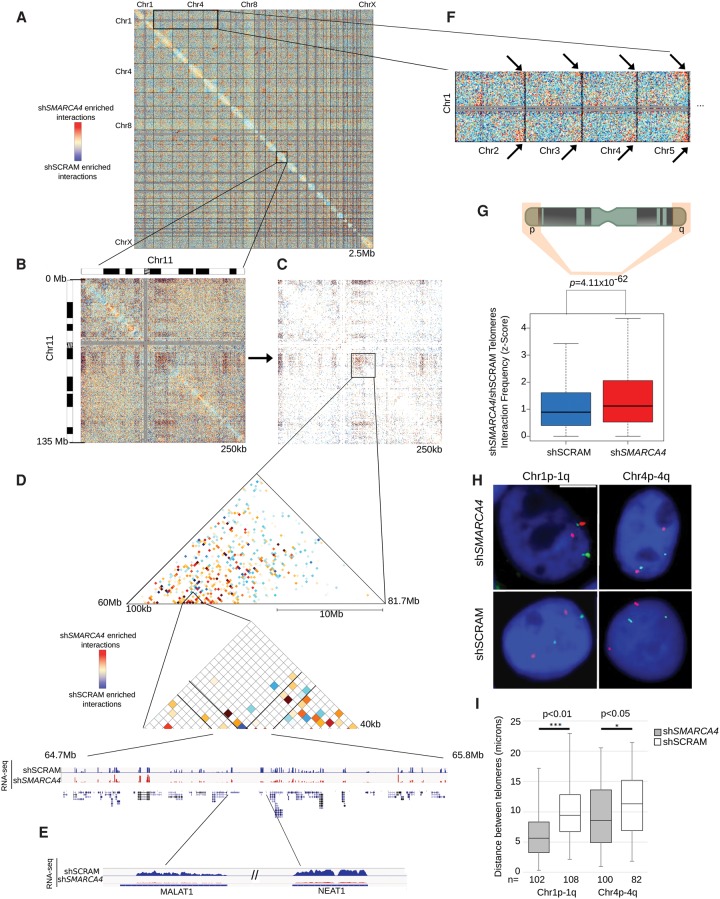
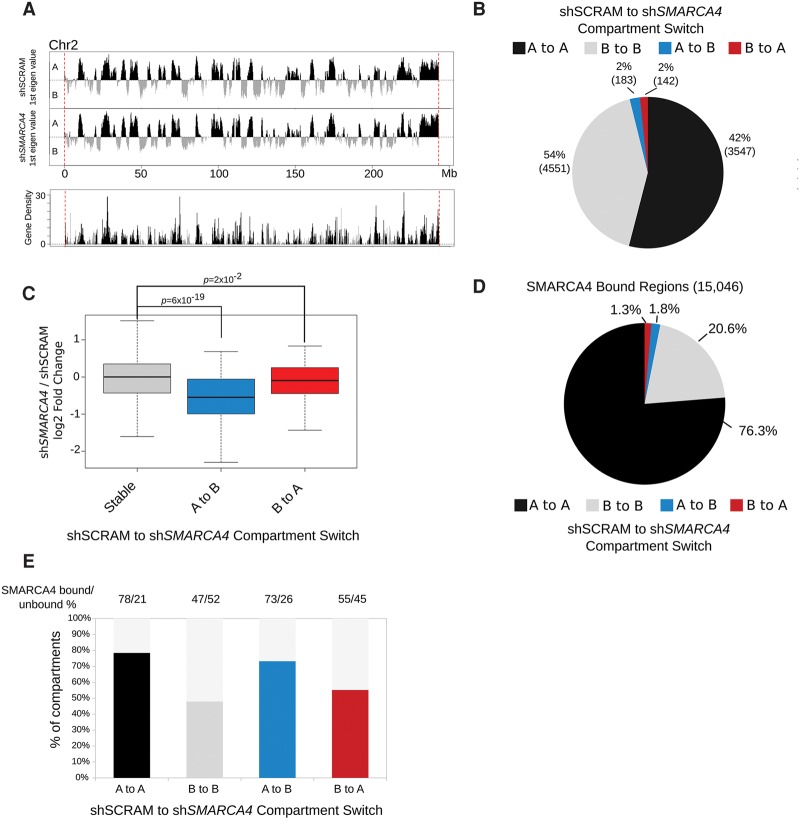
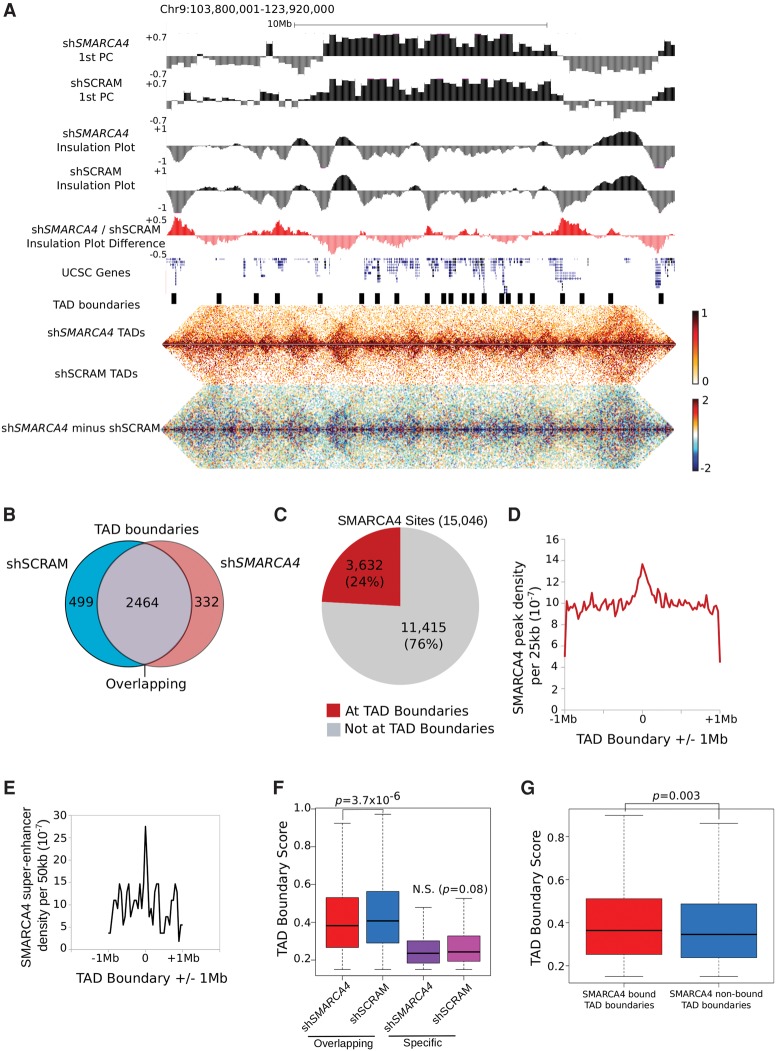
The packaging of DNA into chromatin plays an important role in transcriptional regulation and nuclear processes. Brahma-related gene-1 SMARCA4 (also known as BRG1), the essential ATPase subunit of the mammalian SWI/SNF chromatin remodeling complex, uses the energy from ATP hydrolysis to disrupt nucleosomes at target regions. Although the transcriptional role of SMARCA4 at gene promoters is well-studied, less is known about its role in higher-order genome organization. SMARCA4 knockdown in human mammary epithelial MCF-10A cells resulted in 176 up-regulated genes, including many related to lipid and calcium metabolism, and 1292 down-regulated genes, some of which encode extracellular matrix (ECM) components that can exert mechanical forces and affect nuclear structure. ChIP-seq analysis of SMARCA4 localization and SMARCA4-bound super-enhancers demonstrated extensive binding at intergenic regions. Furthermore, Hi-C analysis showed extensive SMARCA4-mediated alterations in higher-order genome organization at multiple resolutions. First, SMARCA4 knockdown resulted in clustering of intra- and inter-subtelomeric regions, demonstrating a novel role for SMARCA4 in telomere organization. SMARCA4 binding was enriched at topologically associating domain (TAD) boundaries, and SMARCA4 knockdown resulted in weakening of TAD boundary strength. Taken together, these findings provide a dynamic view of SMARCA4-dependent changes in higher-order chromatin organization and gene expression, identifying SMARCA4 as a novel component of chromatin organization.


Figures

Figure 1.
Figure 1.
(A) Western blot of the SMARCA4 protein levels of shSCRAM and shSMARCA4 MCF-10A cells in the noninduced (DOX−) and induced (DOX+) conditions. Lower: Quantification of the Western blot showing ∼85% reduction of SMARCA4 protein levels upon doxycyline induction. (B) Scatter plot showing the log2 gene expression values for shSMARCA4 and shSCRAM cells. The red and blue dots denote the up- and down-regulated genes between the two conditions, respectively. (C) Heatmap showing the transcripts per million (TPM) expression values of the differentially expressed genes between shSCRAM and shSMARCA4 for each biological replicate. (D,E) Bar graphs showing the −log10 P-values for the REACTOME terms of the (D) 1292 genes that are down-regulated and (E) 176 up-regulated genes upon SMARCA4 knockdown.
Figure 2.
Figure 2.
(A) Example of a ChIP-seq genome browser view of SMARCA4 binding and the input control, the shSCRAM and shSMARCA4 RNA-seq on Chr 5, and a zoom-in on the VCAN (Versican) gene, which is regulated by SMARCA4, in the lower panel. The y-axis represents the normalized tag densities relative to hg19 genomic coordinates. (B) Distribution of SMARCA4 ChIP-seq peak annotation for genic and intergenic regions. (C) Normalized SMARCA4 ChIP-seq signal intensity plot for all human UCSC genes ±2 kb. SMARCA4 binding is enriched at the promoter regions. (D) Top five sequence motifs associated with the SMARCA4 peaks. (E) SMARCA4 peak density within ±20 kb of the TSS of significantly down-regulated (blue), or up-regulated genes (red). (F) Distribution of SMARCA4 ChIP-seq signal across the MCF-10A enhancers. SMARCA4 binding is not uniformly distributed across the enhancers, as 109 super-enhancers display higher (log2 ∼1.5-fold) levels of SMARCA4 binding. (G) SMARCA4 signal is greater over super-enhancers (red) than typical enhancers (green). (H) Distribution of SMARCA4-bound super-enhancers in genic and intergenic regions.
Figure 3.
Figure 3.
Genome-wide all-by-all Hi-C interaction heatmaps at 1-Mb resolution and a zoom-in of Chr 11 at 250-kb resolution (middle) and at 40-kb resolution (lower) in MCF-10A shSCRAM (A) and MCF-10A shSMARCA4 cells (B). For the genome-wide heatmaps, the chromosomes are stacked from top-left to bottom-right in order (Chr 1, Chr 2, …, Chr 22, and Chr X). The gray regions indicate repetitive regions (such as centromeres) in which the sequencing reads could not be mapped. The genomic compartments are shown below the middle heatmaps.
Figure 4.
Figure 4.
(A) Genome wide interaction heatmap at 2.5 Mb resolution showing the differences between interactions that are gained and lost upon SMARCA4 knockdown. The chromosomes are stacked from top-left to bottom-right in order (Chr 1, Chr 2, …, Chr 22, and Chr X). (B) A zoom-in of Chr 11 at 250-kb resolution showing all differential interactions. (C) The interactions that are altered with significance (see Methods). (D) A further zoom-in view of a genomic region on Chr 11 (Chr 11: 60000001–81750000) (top) showing the differential interactions where the MALAT1 and NEAT1 loci reside (Chr 11: 64750339–65807685). (E) RNA-seq tracks from shSMARCA4 and shSCRAM cells showing a reduction of expression in NEAT1 and MALAT1 lncRNA genes upon SMARCA4 knockdown. (F) A zoom-in of the inter-chromosomal interactions between Chr 1 and Chr 2 through Chr 5, with arrows indicating the enriched telomeric interactions in the shSMARCA4 cells. This pattern of subtelomeric interaction occurs throughout the genome. (G) Quantification of the interactions among subtelomeric ends for shSCRAM and shSMARCA4 Hi-C data sets. The subtelomeric ends show significantly (Student's t-test: P < 0.01 for Chr 1 and P < 0.05 for Chr 4) higher frequency of interactions in shSMARCA4 cells compared to control cells. (H) DNA-FISH images of shSMARCA4 and shSCRAM cells showing the intra-chromosomal telomeric interactions of Chr 1 and Chr 4. (I) Box plot showing the quantification of the telomere distances in shSMARCA4 and shSCRAM cells, quantified as described in the methods. P-value: Student's t-test.
Figure 5.
Figure 5.
(A) Compartment profiles (the first principal components) of shSCRAM and shSMARCA4 data for Chr 2. The A-type (open) compartments are shown in black, and the B-type (closed) compartments are shown in gray. The same color scheme was used for the gene density plot for Chr 2 in the lower panel. (B) Pie chart showing the genomic compartment changes between shSCRAM and shSMARCA4 data sets. “A” and “B” denote the open and closed compartments, respectively. “A to A” represents compartments that are open in both cell lines; “B to B” represents compartments that are closed in both cell lines; “A to B” denotes compartments that are open in shSCRAM but closed in shSMARCA4; and “B to A” denotes compartments that are closed in shSCRAM and open in shSMARCA4. (C) shSMARCA4/shSCRAM log2 fold change RNA-seq expression box plot of all the genes residing at regions for different compartmental switch categories. The compartments that are switched from A to B and from B to A show significantly decreased and increased expression levels, respectively. P-value: Wilcoxon rank-sum test. (D) Pie chart showing the compartment-switching profiles of SMARCA4-bound regions. (E) Bar graph showing the percentage of the compartment-switching regions that are bound by SMARCA4. The colored portions of the graph denote the SMARCA4-bound percentage of each compartment-switching category.
Figure 6.
Figure 6.
(A) An example of a region on Chr 9 (Chr 9: 103800001–123920000) showing (from top to bottom) the compartment profiles of shSMARCA4 and shSCRAM at 250-kb intervals, the insulation plot profiles at 40-kb intervals (see Methods), the insulation plot difference between shSMARCA4 and shSCRAM, hg19 UCSC genes, TAD boundaries, shSMARCA4 and shSCRAM contact heatmaps showing the TADs, and a subtraction of the shSCRAM from the shSMARCA4 contact heatmap. (B) Venn diagram showing that the TAD boundaries are largely similar between shSCRAM and shSMARCA4 Hi-C data sets. (C) Pie chart showing the percentage of SMARCA4 localization at TAD boundaries. (D) The frequency plot of SMARCA4 ChIP-seq peaks per 25 kb for ±1 Mb of every shSMARCA4 TAD boundary. (E) The frequency plot of SMARCA4 super-enhancers per 50 kb for ±1 Mb of every shSMARCA4 TAD boundary. (F) Box plot showing the TAD boundary score distribution for the overlapping and the shSCRAM- and shSMARCA4-specific TAD boundaries. P-value: Wilcoxon rank-sum test. (G) SMARCA4 binding is associated with higher (Wilcoxon rank-sum test; P = 0.003) TAD boundary score. Box plot showing the TAD boundary scores for SMARCA4-bound and unbound TAD boundaries.

References

    1. Barutcu AR, Lajoie BR, McCord RP, Tye CE, Hong D, Messier TL, Browne G, van Wijnen AJ, Lian JB, Stein JL, et al. 2015. Chromatin interaction analysis reveals changes in small chromosome and telomere clustering between epithelial and breast cancer cells. Genome Biol 16: 214. - PMC - PubMed
    1. Belton JM, McCord RP, Gibcus JH, Naumova N, Zhan Y, Dekker J. 2012. Hi-C: a comprehensive technique to capture the conformation of genomes. Methods 58: 268–276. - PMC - PubMed
    1. Bossen C, Murre CS, Chang AN, Mansson R, Rodewald HR, Murre C. 2015. The chromatin remodeler Brg1 activates enhancer repertoires to establish B cell identity and modulate cell growth. Nat Immunol 16: 775–784. - PMC - PubMed
    1. Bultman S, Gebuhr T, Yee D, La Mantia C, Nicholson J, Gilliam A, Randazzo F, Metzger D, Chambon P, Crabtree G, et al. 2000. A Brg1 null mutation in the mouse reveals functional differences among mammalian SWI/SNF complexes. Mol Cell 6: 1287–1295. - PubMed
    1. Bultman SJ, Herschkowitz JI, Godfrey V, Gebuhr TC, Yaniv M, Perou CM, Magnuson T. 2008. Characterization of mammary tumors from Brg1 heterozygous mice. Oncogene 27: 460–468. - PubMed

Publication types