. 2016 Nov;33(11):2801-2814.
doi: 10.1093/molbev/msw144. Epub 2016 Jul 19.

Deciphering the Wisent Demographic and Adaptive Histories from Individual Whole-Genome Sequences

Affiliations

Deciphering the Wisent Demographic and Adaptive Histories from Individual Whole-Genome Sequences

Mathieu Gautier et al. Mol Biol Evol. 2016 Nov.

Abstract

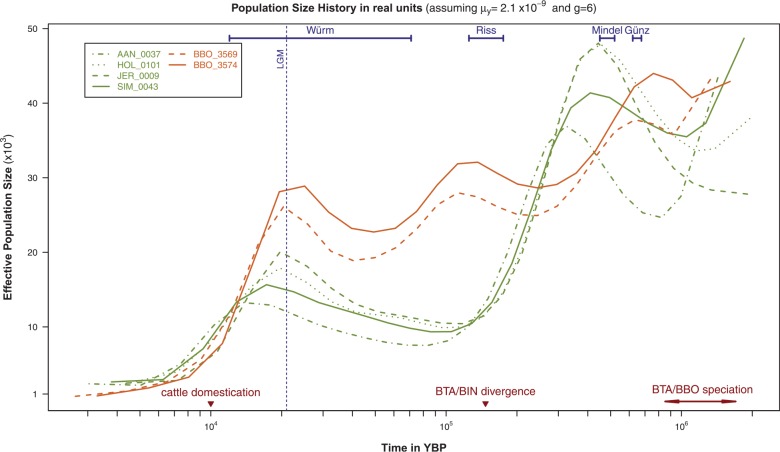
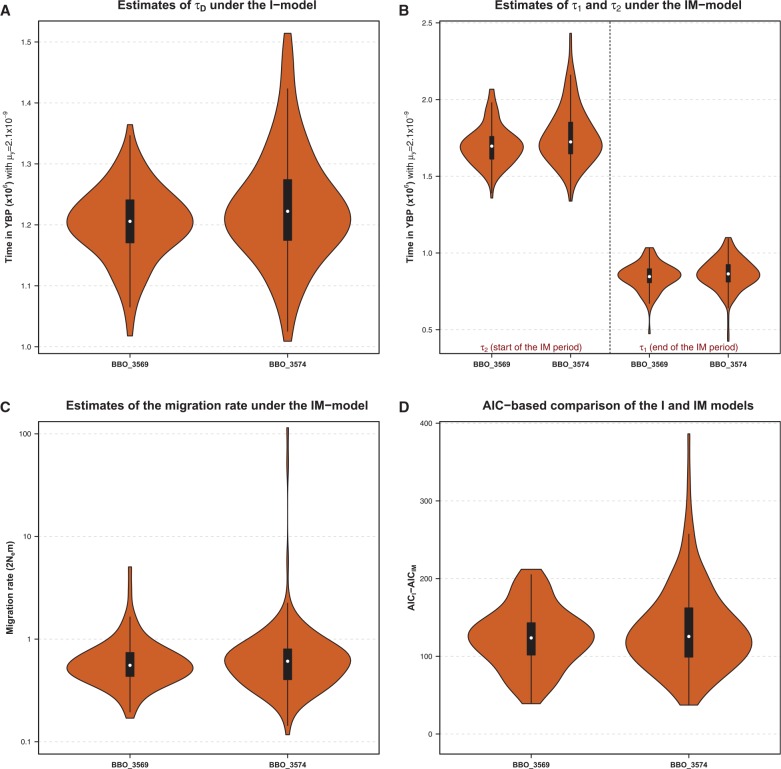
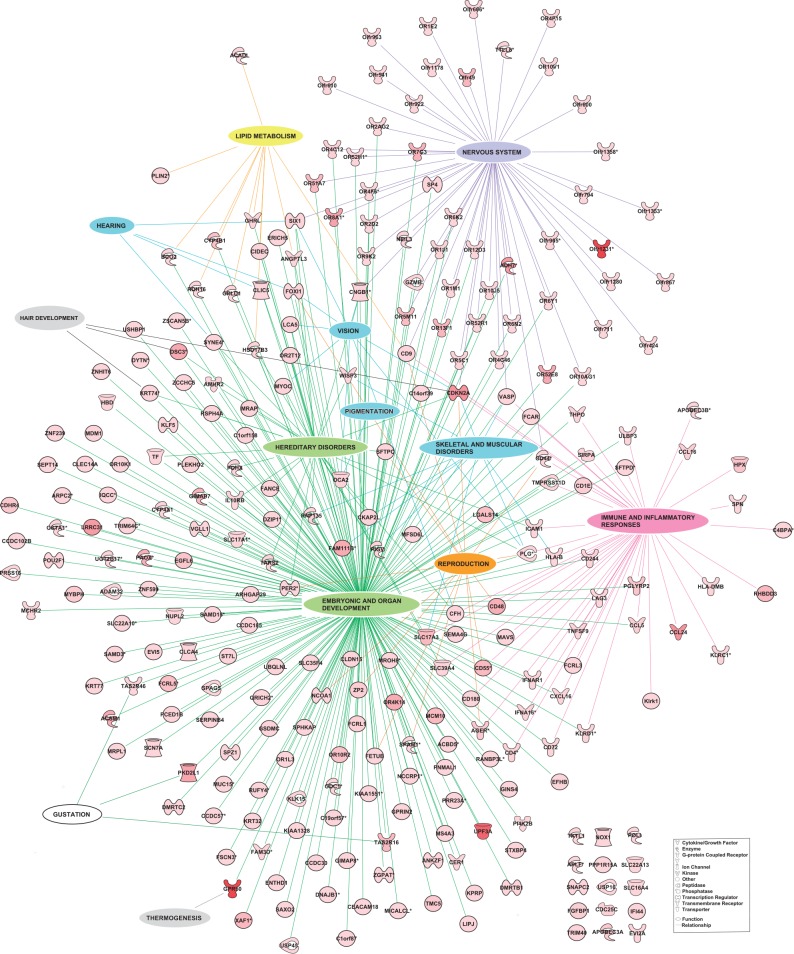
As the largest European herbivore, the wisent (Bison bonasus) is emblematic of the continent wildlife but has unclear origins. Here, we infer its demographic and adaptive histories from two individual whole-genome sequences via a detailed comparative analysis with bovine genomes. We estimate that the wisent and bovine species diverged from 1.7 × 10⁶ to 850,000 years before present (YBP) through a speciation process involving an extended period of limited gene flow. Our data further support the occurrence of more recent secondary contacts, posterior to the Bos taurus and Bos indicus divergence (∼150,000 YBP), between the wisent and (European) taurine cattle lineages. Although the wisent and bovine population sizes experienced a similar sharp decline since the Last Glacial Maximum, we find that the wisent demography remained more fluctuating during the Pleistocene. This is in agreement with a scenario in which wisents responded to successive glaciations by habitat fragmentation rather than southward and eastward migration as for the bovine ancestors. We finally detect 423 genes under positive selection between the wisent and bovine lineages, which shed a new light on the genome response to different living conditions (temperature, available food resource, and pathogen exposure) and on the key gene functions altered by the domestication process.

Keywords: European bison; adaptation; cattle; demography; domestication; evolution; genetics; systems biology.


Figures

Fig. 1
Fig. 1
Population size histories inferred from the two wisent and the four bovine genomes under the PSMC model. Backward in time (in YBP) estimates of the effective population sizes derived from the psmc analyses of the BBO_3569 and BBO_3574 individual wisent genomes and the AAN_0037, HOL_0101, JER_0009, and SIM_0043 bull bovine genomes and assuming μy=2.10 × 10-9 (Liu et al. 2006) and g = 6 (Keightley and Eyre-Walker 2000; Gautier et al. 2007). At the bottom of the figure, the timing of cattle domestication and the zebu (BIN) and taurine (BTA) divergence (Ho et al. 2008) are indicated by a dark red triangle while the timing interval of the bovine and wisent divergence (see the main text) is indicated by dark red arrows. Similarly, European ice ages (Würm, Riss, Mindel, and Günz glacial stages) according to the Penck and Bruckner work (Penck and Brückner 1901–1909) cited in Elias (2013) are indicated by blue intervals at the top of the figure. Finally, the LGM, approximately 20,000 YBP (Clark et al. 2009), is indicated by a vertical blue dotted line.
Fig. 2
Fig. 2
Characterization of the divergence between the BBO and BTA lineages under the isolation (I-) and the isolation-with-migration (IM-) models. (A) Estimation of the time τD of divergence between the BBO and BTA lineages under the I model (that assumes a clean split). The two violin plots show the distribution of τD estimates obtained for each 10 Mb nonoverlapping segments from the alignments of the BBO_3569 (n = 123 segments) and BBO_3574 (n = 177 segments) whole-genome sequence onto the UMD 3.1 bovine genome assembly. Time scale was translated into YBP assuming μy=2.10 × 10-9 (Liu et al. 2006). (B) Estimation of starting (τ2) and ending (τ1) time estimates of the divergence between the BBO and BTA lineages under the IM model (that assumes the two ancestral lineages exchange migrants between τ2 and τ1). The violin plots show the distribution of τ2 and τ1 time estimates obtained for each 10 Mb nonoverlapping segments from the alignments of the BBO_3569 (n = 123 segments) and BBO_3574 (n = 177 segments) whole-genome sequence onto the UMD 3.1 bovine genome assembly. Time scale was translated into YBP assuming μy=2.10×10⁻⁹ (Liu et al. 2006). (C) Estimation of the average number of migrant per generation (2Nem) during the divergence of the BBO and BTA lineages under the IM model. The two violin plots show the distribution of the migration rate estimates obtained for each 10 Mb nonoverlapping segments from the alignments of the BBO_3569 (n = 123 segments) and BBO_3574 (n = 177 segments) whole-genome sequence onto the UMD 3.1 bovine genome assembly. (D) Model comparisons between the I and the IM models. The two violin plots show the distribution of the difference between the Akaike Information Criterion for the isolation (AICI) and for the IM (AICIM) obtained for each 10 Mb nonoverlapping segments from the alignments of the BBO_3569 (n = 123 segments) and BBO_3574 (n = 177 segments) whole-genome sequence onto the UMD 3.1 bovine genome assembly. Because the model with the smallest AIC should be preferred, the distributions provide strong support in favor of the IM-model (AICIM is always lower than AICI).
Fig. 3
Fig. 3
Representation of the genes with a Ka/Ks >1 connected to their key functions. Each global function and its links to the corresponding key genes are differently colored, that is, in purple for nervous system, blue for by-products of domestication, green for functions related to embryonic, organ development and hereditary disorders, pink for immune and inflammatory responses, orange for reproduction, gray for hair development and thermogenesis, yellow for lipid metabolism, and white for gustation. Global functions contain genes belonging to several Ingenuity Pathway Analysis functional categories. Gene symbols are colored in red and color intensity is correlated to the Ka/Ks value.

Comment in

References

    1. Ayub M, Basit S, Jelani M, Ur Rehman F, Iqbal M, Yasinzai M, Ahmad W. 2009. A homozygous nonsense mutation in the human desmocollin-3 (DSC3) gene underlies hereditary hypotrichosis and recurrent skin vesicles. Am J Hum Genet. 85:515–520. - PMC - PubMed
    1. Bechtold DA, Sidibe A, Saer BR, Li J, Hand LE, Ivanova EA, Darras VM, Dam J, Jockers R, Luckman SM, et al. 2012. A role for the melatonin-related receptor GPR50 in leptin signaling, adaptive thermogenesis, and torpor. Curr Biol. 22:70–77. - PubMed
    1. Belyaev DK. 1979. The Wilhelmine E. Key 1978 invitational lecture. Destabilizing selection as a factor in domestication. J Hered. 70:301–308. - PubMed
    1. Benecke N. 2005. The Holocene distribution of European bison-the archaeozoological record. Munibe (Antropologia-Arkeologia) 57:421–428.
    1. Bocherens H, Hofman-Kamińska E, Drucker DG, Schmolcke U, Kowalczyk R. 2015. European bison as a refugee species? Evidence from isotopic data on Early Holocene bison and other large herbivores in northern Europe. PLoS One 10:e0115090.. - PMC - PubMed

Publication types