

Genomic content typifying a prevalent clade of bovine mastitis-associated Escherichia coli
- PMID: 27436046
- PMCID: PMC4951805
- DOI: 10.1038/srep30115
Genomic content typifying a prevalent clade of bovine mastitis-associated Escherichia coli
Erratum in
-
Publisher Correction: Genomic content typifying a prevalent clade of bovine mastitis-associated Escherichia coli.Sci Rep. 2020 Sep 25;10(1):16071. doi: 10.1038/s41598-020-72806-w. Sci Rep. 2020. PMID: 32978502 Free PMC article.
Abstract
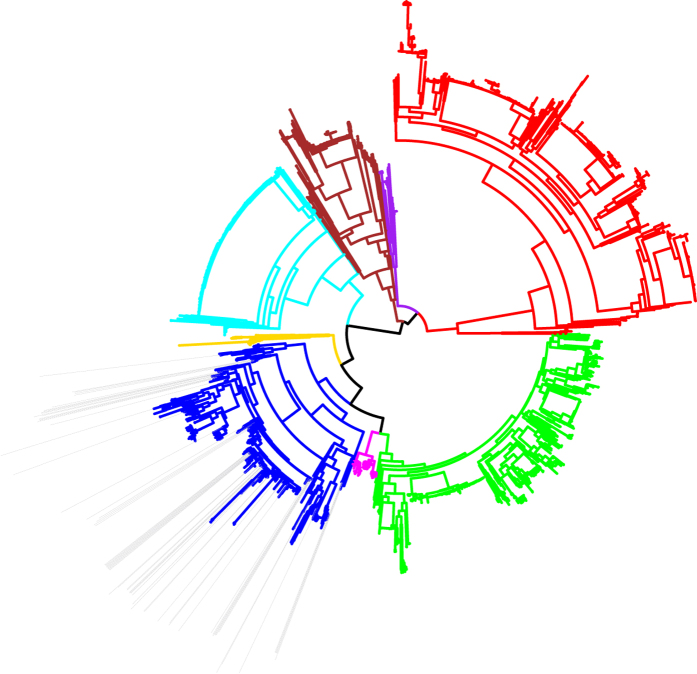
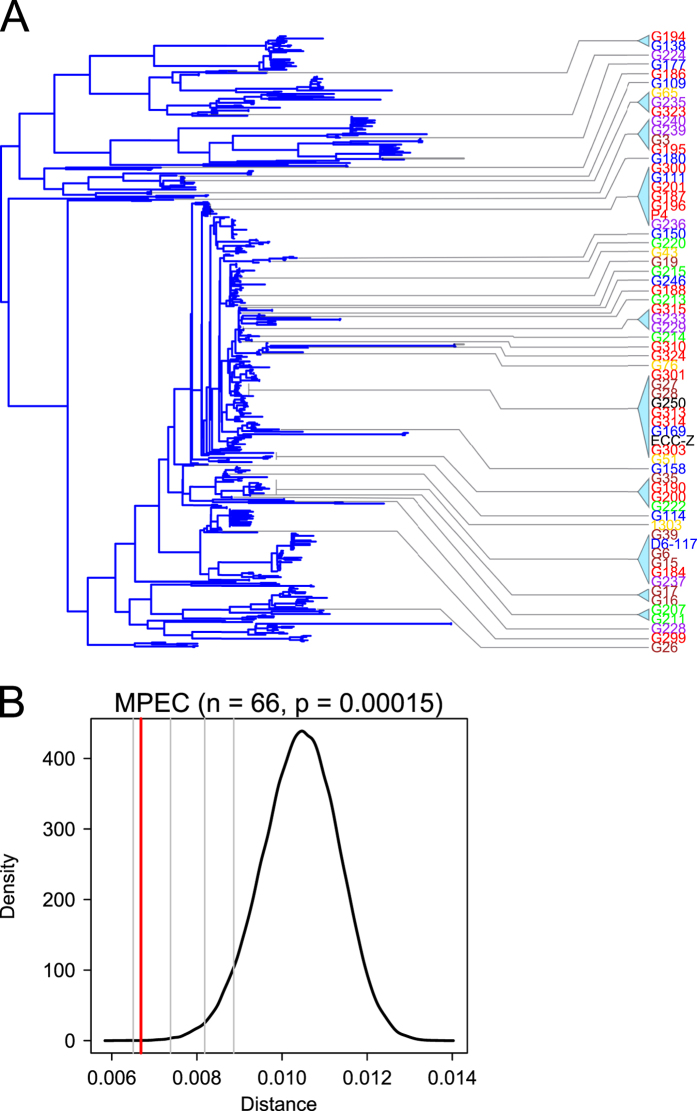
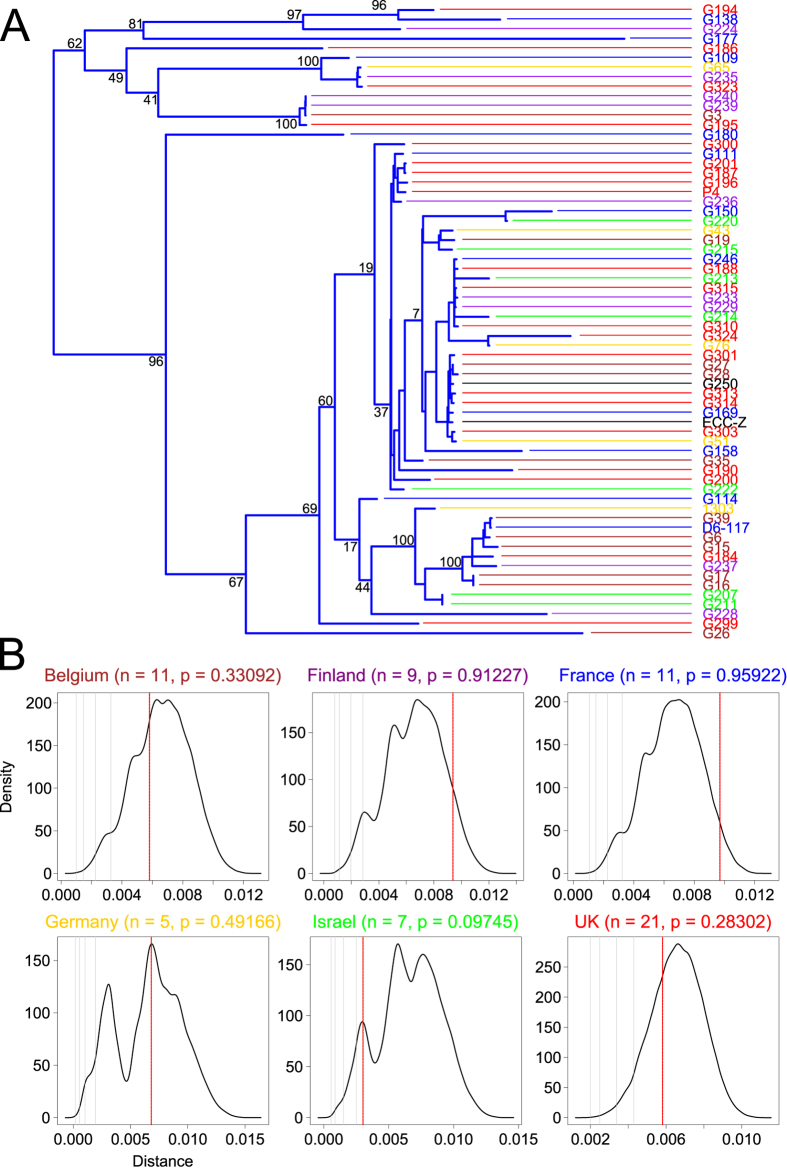
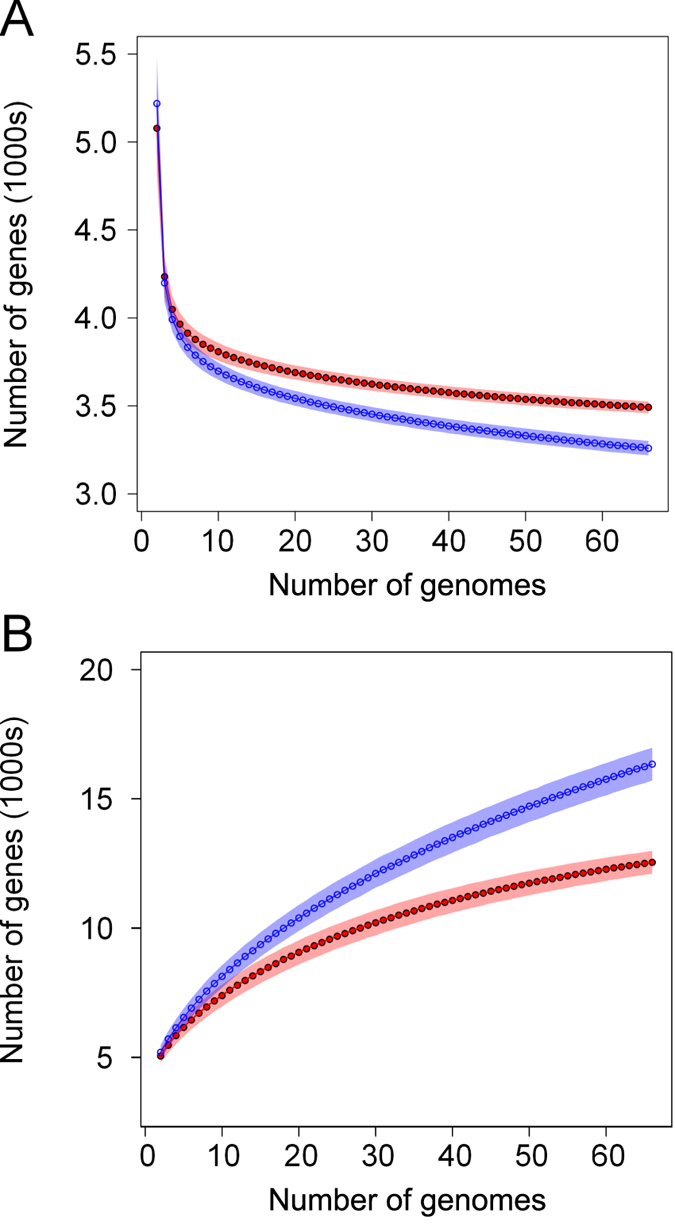
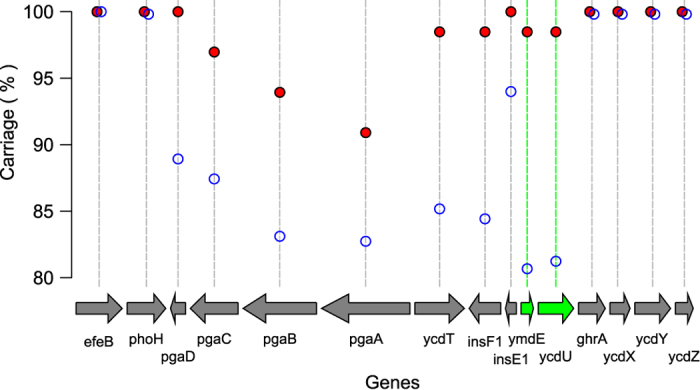
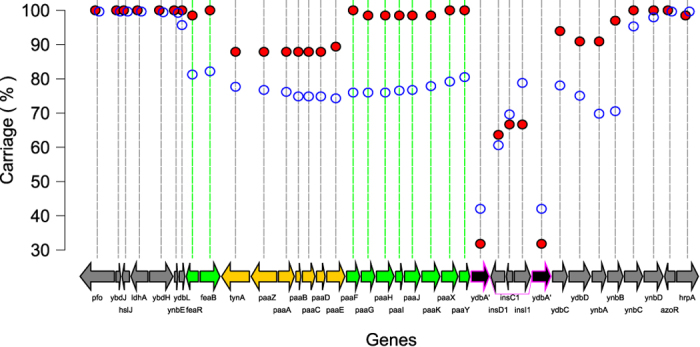
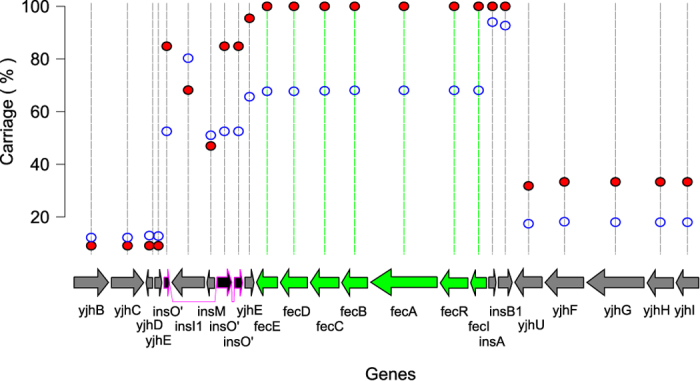
E. coli represents a heterogeneous population with capabilities to cause disease in several anatomical sites. Among sites that can be colonised is the bovine mammary gland (udder) and a distinct class of mammary pathogenic E. coli (MPEC) has been proposed. MPEC are the principle causative agents of bovine mastitis in well-managed dairy farms, costing producers in the European Union an estimated €2 billion per year. Despite the economic impact, and the threat this disease presents to small and medium sized dairy farmers, the factors which mediate the ability for E. coli to thrive in bovine mammary tissue remain poorly elucidated. Strains belonging to E. coli phylogroup A are most frequently isolated from mastitis. In this paper, we apply a population level genomic analysis to this group of E. coli to uncover genomic signatures of mammary infectivity. Through a robust statistical analysis, we show that not all strains of E. coli are equally likely to cause mastitis, and those that do possess specific gene content that may promote their adaptation and survival in the bovine udder. Through a pan-genomic analysis, we identify just three genetic loci which are ubiquitous in MPEC, but appear dispensable for E. coli from other niches.
Figures
Similar articles
-
Comparative genomic analysis of Escherichia coli isolates from cases of bovine clinical mastitis identifies nine specific pathotype marker genes.Microb Genom. 2021 Jul;7(7):000597. doi: 10.1099/mgen.0.000597. Microb Genom. 2021. Retraction in: Microb Genom. 2024 Dec;10(12). doi: 10.1099/mgen.0.001343. PMID: 34227932 Free PMC article. Retracted.
-
Postgenomics Characterization of an Essential Genetic Determinant of Mammary Pathogenic Escherichia coli.mBio. 2018 Apr 3;9(2):e00423-18. doi: 10.1128/mBio.00423-18. mBio. 2018. PMID: 29615502 Free PMC article.
-
Genome-Wide Identification of Fitness Factors in Mastitis-Associated Escherichia coli.Appl Environ Microbiol. 2018 Jan 2;84(2):e02190-17. doi: 10.1128/AEM.02190-17. Print 2018 Jan 15. Appl Environ Microbiol. 2018. PMID: 29101196 Free PMC article.
-
Invited review: Mastitis Escherichia coli strains-Mastitis-associated or mammo-pathogenic?J Dairy Sci. 2025 May;108(5):4485-4507. doi: 10.3168/jds.2024-26109. Epub 2025 Mar 24. J Dairy Sci. 2025. PMID: 40139360 Review.
-
Invited review: Microbiota of the bovine udder: Contributing factors and potential implications for udder health and mastitis susceptibility.J Dairy Sci. 2018 Dec;101(12):10605-10625. doi: 10.3168/jds.2018-14860. Epub 2018 Oct 3. J Dairy Sci. 2018. PMID: 30292553 Review.
Cited by
-
Immunomodulation of Host Chitinase 3-Like 1 During a Mammary Pathogenic Escherichia coli Infection.Front Immunol. 2018 May 28;9:1143. doi: 10.3389/fimmu.2018.01143. eCollection 2018. Front Immunol. 2018. PMID: 29892291 Free PMC article.
-
Escherichia coli Mastitis in Dairy Cattle: Etiology, Diagnosis, and Treatment Challenges.Front Microbiol. 2022 Jul 7;13:928346. doi: 10.3389/fmicb.2022.928346. eCollection 2022. Front Microbiol. 2022. PMID: 35875575 Free PMC article. Review.
-
Bile Salts Regulate Zinc Uptake and Capsule Synthesis in a Mastitis-Associated Extraintestinal Pathogenic Escherichia coli Strain.Infect Immun. 2021 Sep 16;89(10):e0035721. doi: 10.1128/IAI.00357-21. Epub 2021 Jul 6. Infect Immun. 2021. PMID: 34228495 Free PMC article.
-
Draft Genome Sequences of 113 Escherichia coli Strains Isolated from Intramammary Infections in Dairy Cattle.Microbiol Resour Announc. 2021 Feb 18;10(7):e01464-20. doi: 10.1128/MRA.01464-20. Microbiol Resour Announc. 2021. PMID: 33602739 Free PMC article.
-
Comparative genomic analysis of Escherichia coli isolates from cases of bovine clinical mastitis identifies nine specific pathotype marker genes.Microb Genom. 2021 Jul;7(7):000597. doi: 10.1099/mgen.0.000597. Microb Genom. 2021. Retraction in: Microb Genom. 2024 Dec;10(12). doi: 10.1099/mgen.0.001343. PMID: 34227932 Free PMC article. Retracted.
References
-
- Sousa C. P. The versatile strategies of Escherichia coli pathotypes: a mini review. J. Venom. Anim. Toxins incl. Trop. Dis. 12, 363–373 (2006).
-
- Johnson J. R. & Russo T. A. Extraintestinal pathogenic Escherichia coli: “The other bad E. coli ”. J. Lab. Clin. Med. 139, 155–162 (2002). - PubMed
-
- Kaper J. B., Nataro J. P. & Mobley H. L. T. Pathogenic Escherichia coli. Nat. Rev. Micro. 2, 123–140 (2004). - PubMed
-
- Clermont O., Christenson J. K., Denamur E. & Gordon D. M. The Clermont Escherichia coli phylo-typing method revisited: improvement of specificity and detection of new phylo-groups. Environ. Microbiol. Rep. 5, 58–65 (2013). - PubMed
Publication types
MeSH terms
Substances
Grants and funding
LinkOut - more resources
Full Text Sources
Other Literature Sources
Medical
