. 2016 Jul 20:5:e17812.
doi: 10.7554/eLife.17812.

Monochromatic multicomponent fluorescence sedimentation velocity for the study of high-affinity protein interactions

Affiliations

Monochromatic multicomponent fluorescence sedimentation velocity for the study of high-affinity protein interactions

Huaying Zhao et al. Elife. .

Abstract

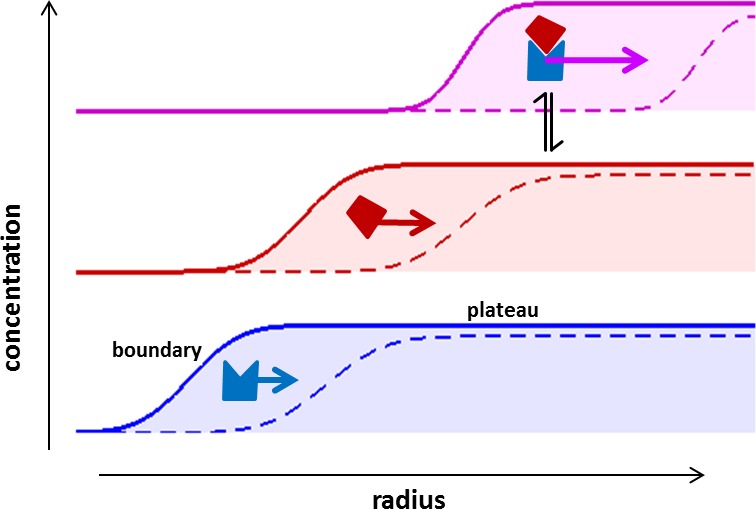
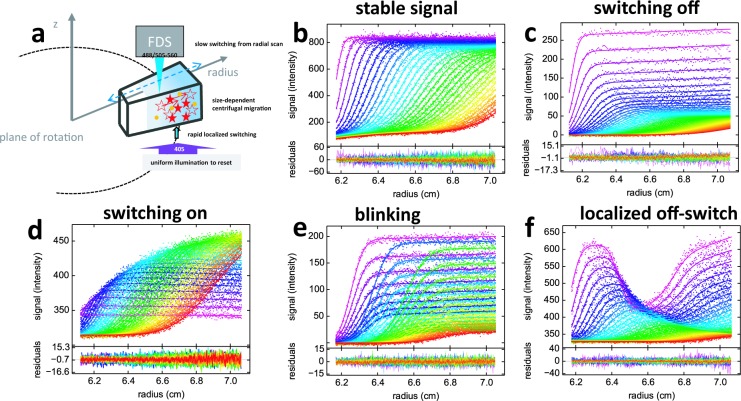
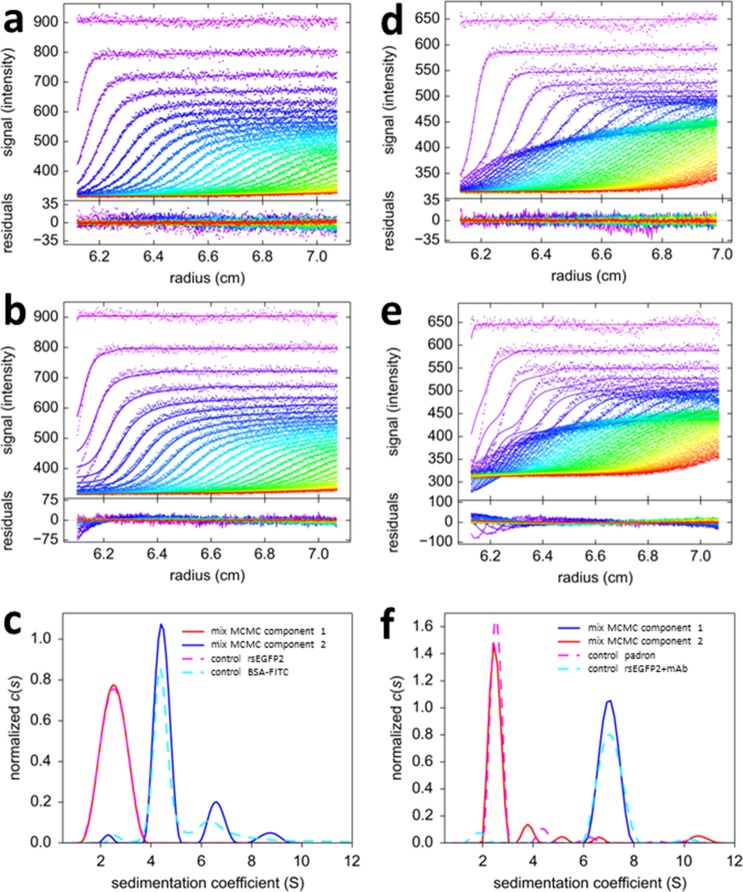
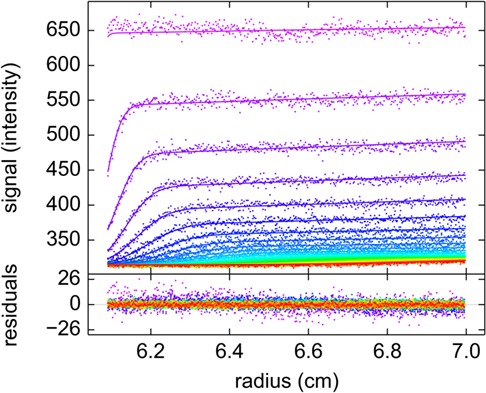
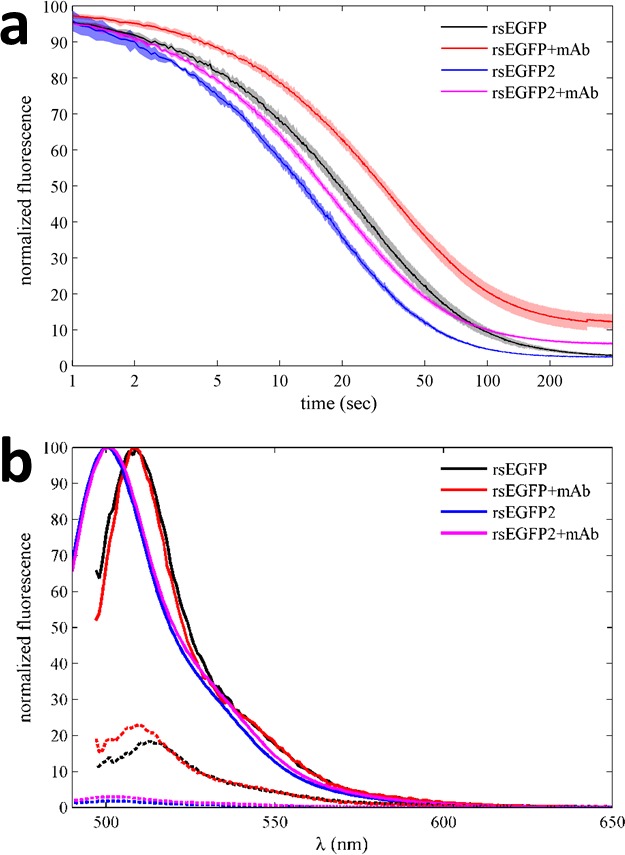
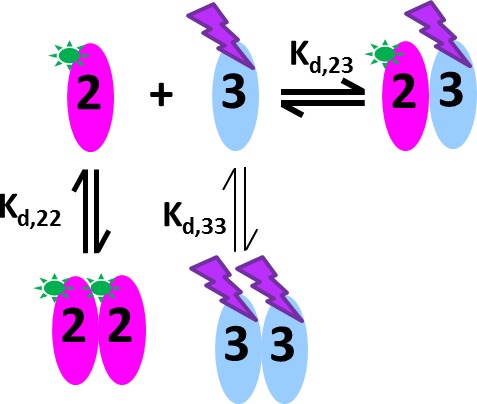
The dynamic assembly of multi-protein complexes underlies fundamental processes in cell biology. A mechanistic understanding of assemblies requires accurate measurement of their stoichiometry, affinity and cooperativity, and frequently consideration of multiple co-existing complexes. Sedimentation velocity analytical ultracentrifugation equipped with fluorescence detection (FDS-SV) allows the characterization of protein complexes free in solution with high size resolution, at concentrations in the nanomolar and picomolar range. Here, we extend the capabilities of FDS-SV with a single excitation wavelength from single-component to multi-component detection using photoswitchable fluorescent proteins (psFPs). We exploit their characteristic quantum yield of photo-switching to imprint spatio-temporal modulations onto the sedimentation signal that reveal different psFP-tagged protein components in the mixture. This novel approach facilitates studies of heterogeneous multi-protein complexes at orders of magnitude lower concentrations and for higher-affinity systems than previously possible. Using this technique we studied high-affinity interactions between the amino-terminal domains of GluA2 and GluA3 AMPA receptors.

Keywords: analytical ultracentrifugation; biophysics; hydrodynamics; photoswitchable fluorescent proteins; protein interactions; structural biology.


Conflict of interest statement

The authors declare that no competing interests exist.

Figures

Figure 1.
Figure 1.. Concentration profiles in a sedimentation velocity experiment.
Two different macromolecular components are depicted (blue and red) reversibly forming a complex (magenta). As a result of centrifugal force at 200,000–300,000 g, macromolecules sediment at a rate determined by their mass, density, and Stokes radius (or translational friction coefficient) (Svedberg and Rinde, 1924). The velocity of sedimentation normalized relative to the centrifugal field strength is expressed in the molecular sedimentation coefficient s. With time, transport clears the region of the solution column closest to the center of rotation and a moving front is formed -- the sedimentation boundary – that separates the cleared zone from a zone of constant concentration named the solution plateau region. While the boundary moves with time (dashed vs solid line), the concentration in the plateau region continuously decreases, solely due the radial geometry of sedimentation resulting in an increase in intermolecular distances (for a detailed description, see Schuck et al., 2015). If protein interactions cause complexes to form, these generally sediment faster and therefore migrate through a bath of slower sedimenting free constituent components. This allows association/dissociation reactions to continuously occur in a way that reflects equilibrium and kinetic properties of the interaction, at the same time as the complex boundaries are hydrodynamically resolved (Schuck, 2010). The temporal evolution of the boundary shapes is governed by macromolecular diffusion and polydispersity, and the latter can be extracted by mathematical modeling of experimental data in form of sedimentation coefficient distributions (Schuck, 2000). DOI: http://dx.doi.org/10.7554/eLife.17812.003
Figure 2.
Figure 2.. Principle of fluorescence detected sedimentation velocity and optical switching of psFPs.
(a) Schematic setup: A rotating sample solution is scanned radially in a confocal configuration with 488 nm excitation (13 mW unless mentioned otherwise), inducing slow photoswitching of psFPs. Centrifugal forces cause strongly size-dependent migration, as depicted in Figure 1. Optionally, localized exposure at 488 nm or uniform illumination at 405 nm can further modulate the spatio-temporal signal. (b-f) Radial fluorescence scans (dots, color indicating times in order purple-blue-green-yellow-red; every 2nd scan shown) during sedimentation at 50,000 rpm and 20°C for different fluorophores and illumination conditions. More detailed inspection of the data is possible from the associated movies. Solid lines are the best-fit with a single-species (c to f) or distribution (b) model for the sedimentation/diffusion/photoswitching process; residuals are shown in the lower panels. (b) For DL488-GluA2 (5 nM) only a small depletion of plateau signal with time occurs, due to sample dilution as geometrically predicted from radial migration in the sector-shaped sample solution. (see Video 1) (c) rsEGFP (30 nM) exhibits an exponential depletion of the sedimentation signal (see Video 2). (d) Exposure in the scanning beam causes Padron (20 nM) to switch from predominantly dark to a fluorescent state, causing an exponentially saturating signal increase with time (see Video 3). (e) The sedimentation of 10 nM rsEGFP2-GluA3 is recorded with a 25 mW scanning beam, interrupted by 120 s exposures with 405 nm light at time points 40 min (prior to the purple scans), 64 min (prior to the blue scans), and 102 min (prior to the green scans), each time switching fluorophores from dark state back to the fluorescent state (see Video 4). (f) 5 min into the sedimentation run of 5 nM rsEGFP2-GluA3, a localized initial trough was generated by holding the scanning beam stationary at 6.5 cm for 20 min, locally causing strong conversion of fluorophores into the dark state. Standard scans of the sedimentation process follow, highlighting diffusion into the trough superimposed by migration and slow switching off (see Video 5). DOI: http://dx.doi.org/10.7554/eLife.17812.004
Figure 3.
Figure 3.. Mono-chromatic multi-component (MCMC) decomposition of mixtures.
(a) Evolution of radial fluorescence profiles of 20 nM rsEGFP2 and 30 nM FITC-BSA sedimenting at 50,000 rpm and 20°C. Raw data are shown as points with higher color temperature indicating the passage of time (only every second scan shown), and solid lines are the best-fit based on the MCMC distribution model with two components, producing residuals as shown in the lower panel attached. (b) An impostor fit with a conventional c(s) analysis not accounting for time-dependent signal increments, but compensating their effect on plateau levels by artificial inclusion of time-dependent baseline offsets, creates large misfit in the boundary region. (c) The resulting sedimentation coefficient distributions of each fluorophore component from the MCMC analysis of the mixture (solid lines) and in separate control experiments with individual samples (dashed lines). (d) Fluorescence sedimentation data acquired under the same conditions for a mixture of 20 nM rsEGFP2, 20 nM Padron, and 50 nM anti-GFP mAb, presented in the same format as (a). (e) Analogous to (b), showing the best-fit ‘conventional’ boundary model not accounting for time-dependent signal increments while including artificial baseline parameters. (f) Resulting sedimentation coefficient distributions from the MCMC analysis (solid lines) and standard control experiments (dashed lines). DOI: http://dx.doi.org/10.7554/eLife.17812.010
Figure 3—figure supplement 1.
Figure 3—figure supplement 1.. Sedimentation signals of rsEGFP2-GluA3.
Evolution of radial fluorescence profiles of 5 nM rsEGFP2-GluA3 sedimenting at 50,000 rpm and 20°C. Raw data are shown as points with higher color temperature indicating the passage of time (only every second scan shown), and solid lines are the best-fit based on the MCMC distribution model with a single component, producing residuals as shown in the lower panel. DOI: http://dx.doi.org/10.7554/eLife.17812.011
Figure 4.
Figure 4.. Photoswitching behavior and fluorescence emission spectra of EGFP variants in the absence and presence of GFP antibody in a benchtop spectrofluorometer.
(a) Normalized fluorescence data of 500 nM rsEGFP in the presence (red) and absence (black) of equimolar anti-GFP mAb, monitored at 508 nm during excitation at 490 nm. Equivalent experiments for rsEGFP2 in the presence (magenta) and absence (blue) of the same antibody, measured at 502 nm during 483 nm excitation. The incident power density is 3 mW/cm2. The data shown here represent the average of at least four measurements for each sample, with the line width (or patch width) representing the data acquisition errors. (b) Normalized fluorescence spectra of 500 nM rsEGFP with excitation at 490 nm in the presence (red) and absence (black) of equimolar anti-GFP mAb, before (solid lines) and after (dotted lines) photoswitching. Equivalent emission spectra for rsEGFP2 with 483 nm excitation in the presence (magenta) and absence (blue) of the same antibody, before (solid lines) and after (dotted lines) photoswitching. DOI: http://dx.doi.org/10.7554/eLife.17812.012
Figure 5.
Figure 5.. Calculated relative concentration error for distinguishing photoswitching from non-switching FPs in SV, with and without blinking.
The calculations are based on a decaying signal contribution of the psFP with different rate constants, assuming standard sedimentation conditions (12 mm solution column, 20°C, 50,000 rpm, similar to data shown in Figure 2c) and an s-value of 2.8 S. Shown are the predictions of Equation 6 for constant scanning (black) and blinking (magenta) with 2 min reset events occurring at 26 min and 69 min. DOI: http://dx.doi.org/10.7554/eLife.17812.013
Figure 6.
Figure 6.. Blinking fluorescence SV data.
(a) Cartoon illustrating the timing of events in standard vs. blinking experiments. Dependent on sample history, an initial brief illumination with 405 nm may be applied prior to start of centrifugation. In standard time-domain experiments (top) a series of 488 nm scans at constant frequency is initiated shortly after full rotor speed is reached. It causes a gradual depletion of signals for molecules switching off, depicted by the fading blue bar, such as shown in Figure 2c. For blinking experiments (middle and bottom) the sequence of scans was briefly interrupted at select time points (indicated by purple arrows) by short pulses of high-power 405 nm illumination, switching on molecules that switch off at 488 nm such as rsEGFP2 in Figure 2e, or switching off molecules that switch on at 488 nm such as Padron in (b), respectively. (b) Example of blinking data from 30 nM Padron sedimenting at 50,000 rpm and 20°C. Fluorescence scans were acquired with 488 nm excitation in ~5 min intervals (only every second scan shown), interrupted three times by 2 min exposure of the spinning rotor to 405 nm light. During the data acquisition cycles the fluorescence signal increases, due to switching on of Padron, but the increase is reversed each time in the 405 nm light that switches Padron to the off state. At these time points, gaps in the boundary overlay can be visually discerned; these appear largely due to the decreasing signal magnitude of the boundary. The complete fluorescence or dark state is not reached in these cycles, and the fluorescence signal magnitude after 405 nm exposure is treated as a fitting parameter. The solid line is the best-fit combined sedimentation/photoswitching model of a single species with apparent molar mass of 26.9 kDa and s-value of 2.58 S. DOI: http://dx.doi.org/10.7554/eLife.17812.014
Figure 7.
Figure 7.. Cartoon of the mixed homo- and hetero-dimerization of GluA2-ATD and GluA3-ATD.
DL488-GluA2 (magenta) exhibits moderately strong homo-dimerization, while rsEGFP2-GluA3 (blue) undergoes weak homo-dimerization. Both are competitive with a strong hetero-association. DL488-GluA2 provides a constant fluorescent signal contribution, whereas rsEGFP2-GluA3 signals are modulated and can be recognized in the time-domain of the signal. DOI: http://dx.doi.org/10.7554/eLife.17812.015
Figure 8.
Figure 8.. Analysis of the self-association of DL488-GluA2 and rsEGFP2-GluA3.
(a) DL488-GluA2 samples at a series of concentrations from 0.2 nM to 200 nM were sedimented at 50,000 rpm, 20°C and FDS scans were acquired with 488 nm excitation. The resulting SV data were fit to a c(s) model. (b) Isotherm of sw-values determined by integration of c(s) profiles in (a) (circles). The monomer-dimer model of the isotherm (solid line) leads to best-fit values of s1 = 3.57 S, s2 = 5.11 S (uncorrected s-values) and a best-fit Kd,22 of 24 [9–59; 95% CI] nM. (c) Sedimentation coefficient distributions of rsEGFP2-GluA3 at concentrations between 1 nM and 30 nM, determined in blinking configuration as shown in Figure 2e. The constant peak in this concentration range is consistent with the previously determined Kd,33 of 5.6 μM (Zhao et al., 2012). DOI: http://dx.doi.org/10.7554/eLife.17812.016
Figure 9.
Figure 9.. Competitive self-association and hetero-association of DL488-GluA2 and rsEGFP2-GluA3.
Scan data were acquired by FDS-SV, continuously scanning with 488 nm excitation during the sedimentation at 50,000 rpm, 20°C. Data shown are for equimolar concentrations at 0.3 nM (a), 3 nM (b) and 10 nM (c). Solid lines and residuals are from the MCMC decomposition, with pre-determined switching parameters for rsEGFP2-GluA3, leading to distributions shown in Figure 10a. DOI: http://dx.doi.org/10.7554/eLife.17812.017
Figure 10.
Figure 10.. Dilution series analysis of GluA2-GluA3 interaction.
Sedimentation at 50,000 rpm of a dilution series of DL488-GluA2 with equimolar rsEGFP2-GluA3 was observed with 13 mW excitation beam in FDS-SV, causing a decrease of rsEGFP2 signal with time-constant of 5.5×10⁻⁴/sec. (a) Sedimentation coefficient distribution of the decaying signal component of rsEGFP2-GluA3 (blue, reporting on all blue species in Figure 7) and the constant signal component of DL488-GluA2 (magenta, reporting all magenta species in Figure 7) at 30 nM (solid lines), 3 nM (dashed lines) and 0.3 nM (dotted lines). Raw data and fits are in Figure 9. (b) Weighted-average sedimentation coefficients sw for the rsEGFP2-GluA3 (blue circles) and DL488-GluA2 (magenta circles), with 68% CI error bars from Monte-Carlo analysis. The solid line is the best-fit isotherm for a linked homo- hetero-dimerization equilibrium, using a fixed Kd,22 of 27.1 nM for the separately determined GluA2 homo-dimerization. The best-fit estimate for the hetero-dimerization Kd,23 is 0.32 [0.20–0.46] nM. DOI: http://dx.doi.org/10.7554/eLife.17812.018
Figure 11.
Figure 11.. FRAP-like FDS-SV from mixtures of rsEGFP2-GluA3 and DL488-GluA2.
Equimolar mixtures at 0.1 nM (a,c), 2 nM (b,d), 3nM (e,g) and 10 nM (f,h) were sedimented at 50,000 rpm, 20°C, with initial 20 min stationary exposure at 6.5 cm of the excitation beam at 488 nm, prior to radial scanning with 488 nm excitation (every second scan shown). Initial exposure parameters were taken from the rsEGFP2-GluA3 data in Figure 2f and fixed. Solid lines and residuals are from the MCMC decomposition (a,b,e,f) with resulting distributions shown below the scans in panels (c,d,g,h), with the rsEGFP2-GluA3 component in blue and the DL488-GluA2 component in magenta. DOI: http://dx.doi.org/10.7554/eLife.17812.019
Figure 12.
Figure 12.. Component sw isotherm of DL488-GluA2 and rsEGFP2-GluA3 as observed in FRAP-like FDS-SV.
Equimolar mixtures were studied by FDS-SV with initial localized switching, producing data including those shown in Figure 11. Plotted here are component sw-values for rsEGFP2-GluA3 (blue) and DL488-GluA2 (magenta) from integration of the MCMC component sedimentation coefficient distributions. Error bars shown are estimated 68% confidence intervals from Monte-Carlo analysis. The model of competitive homo- and hetero-dimerization (lines) results in an estimate of the heteromer Kd,23 of 0.68 [0.36–1.24, 95% CI] nM. DOI: http://dx.doi.org/10.7554/eLife.17812.020

Similar articles

Cited by

References

    1. Andresen M, Stiel AC, Fölling J, Wenzel D, Schönle A, Egner A, Eggeling C, Hell SW, Jakobs S. Photoswitchable fluorescent proteins enable monochromatic multilabel imaging and dual color fluorescence nanoscopy. Nature Biotechnology. 2008;26:1035–1040. doi: 10.1038/nbt.1493. - DOI - PubMed
    1. Balbo A, Minor KH, Velikovsky CA, Mariuzza RA, Peterson CB, Schuck P. Studying multiprotein complexes by multisignal sedimentation velocity analytical ultracentrifugation. PNAS. 2005;102:81–86. doi: 10.1073/pnas.0408399102. - DOI - PMC - PubMed
    1. Barda-Saad M, Shirasu N, Pauker MH, Hassan N, Perl O, Balbo A, Yamaguchi H, Houtman JC, Appella E, Schuck P, Samelson LE. Cooperative interactions at the SLP-76 complex are critical for actin polymerization. The EMBO Journal. 2010;29:2315–2328. doi: 10.1038/emboj.2010.133. - DOI - PMC - PubMed
    1. Berg J, Hung YP, Yellen G. A genetically encoded fluorescent reporter of ATP:ADP ratio. Nature Methods. 2009;6:161–166. doi: 10.1038/nmeth.1288. - DOI - PMC - PubMed
    1. Brautigam CA, Padrick SB, Schuck P. Multi-signal sedimentation velocity analysis with mass conservation for determining the stoichiometry of protein complexes. PLoS One. 2013;8:e17812. doi: 10.1371/journal.pone.0062694. - DOI - PMC - PubMed

Publication types

MeSH terms

LinkOut - more resources