. 2017 Jul 1;27(7):3586-3599.
doi: 10.1093/cercor/bhw179.

Dynamic Patterns of Brain Structure-Behavior Correlation Across the Lifespan

Affiliations

Dynamic Patterns of Brain Structure-Behavior Correlation Across the Lifespan

Qolamreza R Razlighi et al. Cereb Cortex. .

Abstract

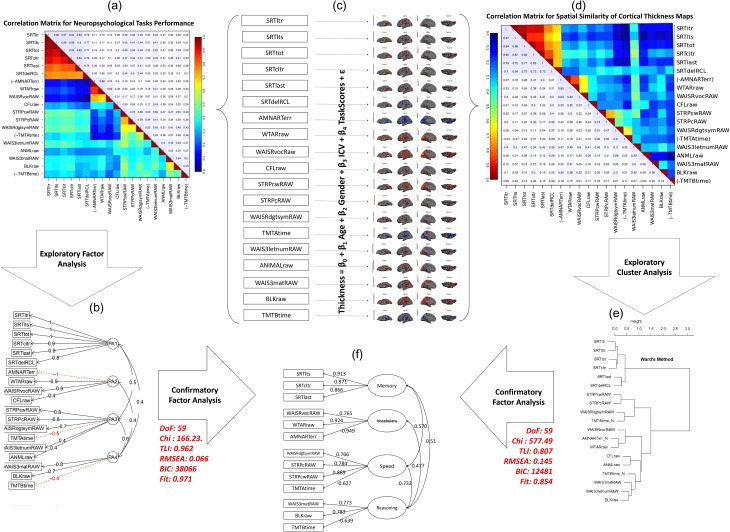
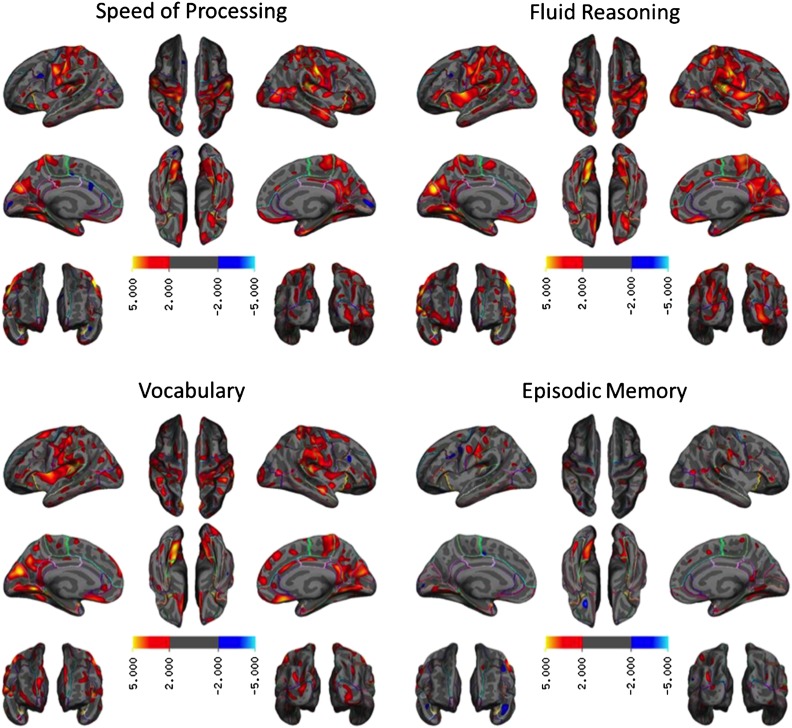
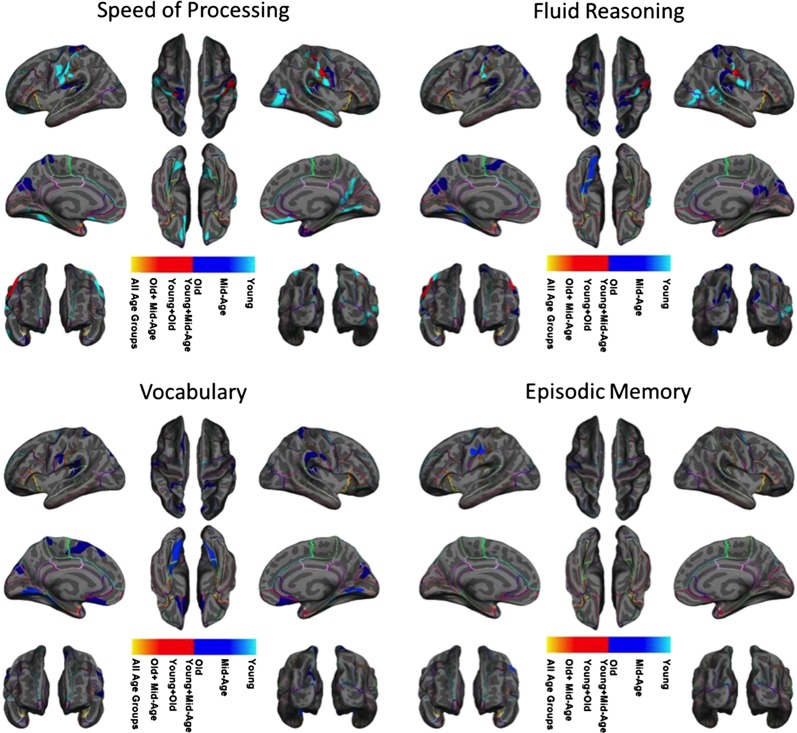
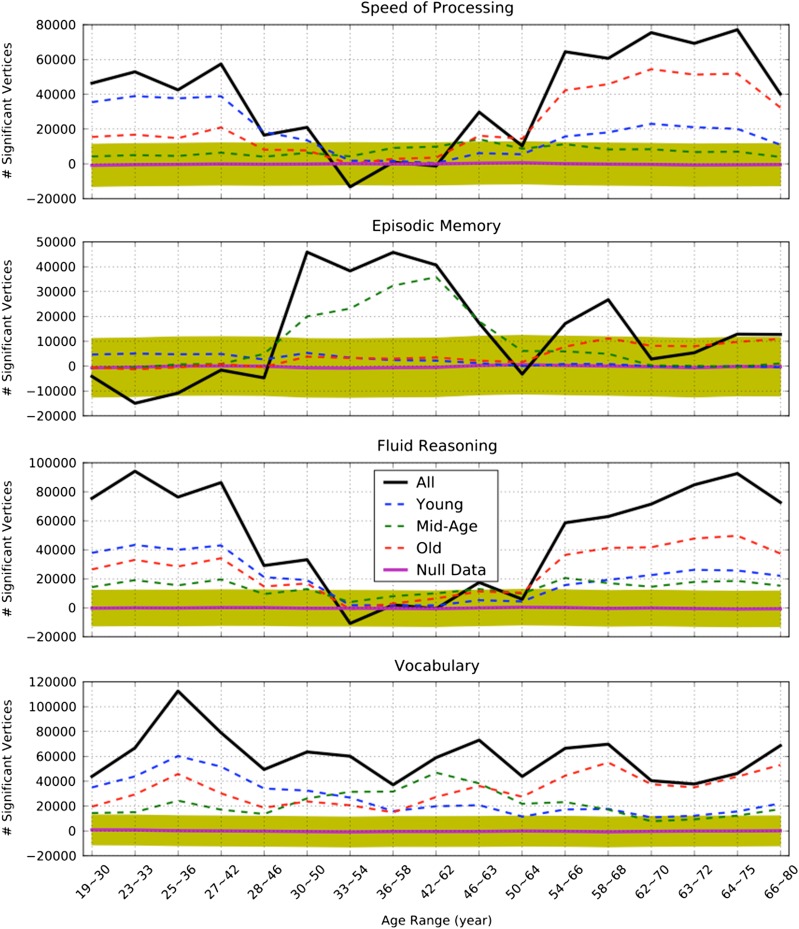
Although the brain/behavior correlation is one of the premises of cognitive neuroscience, there is still no consensus about the relationship between brain measures and cognitive function, and only little is known about the effect of age on this relationship. We investigated the age-associated variations on the spatial patterns of cortical thickness correlates of four cognitive domains. We showed that the spatial distribution of the cortical thickness correlates of each cognitive domain is distinctive and depicts varying age-association differences across the adult lifespan. Specifically, the present study provides evidence that distinct cognitive domains are associated with unique structural patterns in three adulthood periods: Early, middle, and late adulthood. These findings suggest a dynamic interaction between multiple neural substrates supporting each cognitive domain across the adult lifespan.

Keywords: adult lifespan; aging; brain behavior correlation; cognitive domain; cortical thickness.


Figures

Figure 1.
Figure 1.
Cognitive factor structure recapitulated by spatial similarity matrix of associated cortical thickness maps. (a) Correlation matrix obtained from neuropsychological test scores in a number and heat-map color code. (b) Structure of four factors obtained by exploratory PAF analysis of the cognitive data for loadings higher than 0.3 (fit statistics are given in Supplementary Fig. S3). (c) Cortical thickness maps (masked by uncorrected significance level of p < 0.05) associated with each neuropsychological test when age, gender and ICV are taken into account. (d) Spatial similarity matrix in a number and heat-map color code in which the elements reflect pair-wise spatial similarity of the cortical thickness maps obtained in part c. Spatial similarity is measured by Pearson correlation coefficient between beta coefficient of the significant vertices. (e) Exploratory cluster analysis performed on the spatial similarity matrix. (f) Final factor structure obtained from neuropsychological data, validated with their cortical thickness maps and fine-tuned with modification index and simplest rule. The two side arrows indicated the fit statistics of the neuropsychological correlation matrix and the spatial similarity matrix on the final factor structure using confirmatory factor analysis.
Figure 2.
Figure 2.
Age-related differences in four cognitive domain scores and overall mean cortical thickness. Black lines indicate differences between means of the two consecutive decades and yellow stars show the level of their significance (single: p < 0.05, double: p < 0.01, triple: p < 0.005). Cyan dashed line shows the overall linear trend of age-related change and cyan stars show the level of their significance (single: p < 0.05, double: p < 0.01, triple: p < 0.005).
Figure 3.
Figure 3.
Cortical thickness maps associated with each cognitive domain score. The expressions are t statistics and non-significant vertices (uncorrected p < 0.01) are masked out. There were no or few negative relationships between domain scores and cortical thickness. None of the negative relationships survived after correcting for multiple comparisons.
Figure 4.
Figure 4.
Overlap between the four cortical thickness maps associated with four cognitive domain scores. The maps are corrected for cluster-wise multiple comparisons (p < 0.05). The colors identify each cognitive domain mask and illustrate which cognitive domains overlap at each vertex. Level of significance is not presented in this figure.
Figure 5.
Figure 5.
Overlap between the cortical thickness maps associated with each cognitive domain score for each stratified age range. The maps are corrected for cluster-wise multiple comparisons correction (p < 0.05). The colors identify age group masks and illustrate which age group masks overlap at each vertex. Level of significance was not presented in this figure.
Figure 6.
Figure 6.
The age-dependence of the cortical thickness–cognition relationship illustrated by the number of significant vertices predicting each cognitive domain score at difference steps of the sliding window, with and without masking out the regions that are shown to be significant at each age group. Positive numbers indicate a dominantly positive association between cortical thickness and cognition whereas negative numbers show a dominantly negative association between cortical thickness and cognition. A black solid-bold curve shows the total number of significant vertices (uncorrected p < 0.05) predicting each cognitive domain at each step of the sliding window. A blue dash-line curve shows the number of significant vertices within the regions where thickness significantly predicted young participants performance (shown in Fig. 5. Red/green dashed-line curves show the number of significant vertices within the regions where thickness significantly predicted old/mid-age participants’ performance (shown in Fig. 5). A magenta bold-solid line shows the mean of the number of vertices predicting cognition when participants are permuted at each step of the sliding window; the yellow color shaded area depicts 95% confidence interval.

References

    1. Anderson JA, Campbell KL, Amer T, Grady CL, Hasher L.. 2014. Timing is everything: age differences in the cognitive control network are modulated by time of day. Aging. 29:648–657. - PMC - PubMed
    1. Ardekani BA, Braun M, Hutton BF, Kanno I, Iida H.. 1995. A fully automatic multimodality image registration algorithm. J Comput Assist Tomogr. 19:615–623. - PubMed
    1. Benton AL, Hamsher K.. 1989. Multilingual Aphasia Examination. Iowa City (IA): AJA Associates.
    1. Blessed G, Tomlinson BE, Roth M.. 1968. The association between quantitative measures of dementia and of senile change in the cerebral grey matter of elderly subjects. Br J Psychiatry. 114:797–811. - PubMed
    1. Buckner RL, Head D, Parker J, Fotenos AF, Marcus D, Morris JC, Snyder AZ.. 2004. A unified approach for morphometric and functional data analysis in young, old, and demented adults using automated atlas-based head size normalization: reliability and validation against manual measurement of total intracranial volume. NeuroImage. 23:724–738. - PubMed

Publication types

MeSH terms