. 2016 Dec;37(12):4405-4424.
doi: 10.1002/hbm.23318. Epub 2016 Jul 20.

Assessing the performance of different DTI motion correction strategies in the presence of EPI distortion correction

Affiliations

Assessing the performance of different DTI motion correction strategies in the presence of EPI distortion correction

Paul A Taylor et al. Hum Brain Mapp. 2016 Dec.

Abstract

Diffusion tensor imaging (DTI) is susceptible to several artifacts due to eddy currents, echo planar imaging (EPI) distortion and subject motion. While several techniques correct for individual distortion effects, no optimal combination of DTI acquisition and processing has been determined. Here, the effects of several motion correction techniques are investigated while also correcting for EPI distortion: prospective correction, using navigation; retrospective correction, using two different popular packages (FSL and TORTOISE); and the combination of both methods. Data from a pediatric group that exhibited incidental motion in varying degrees are analyzed. Comparisons are carried while implementing eddy current and EPI distortion correction. DTI parameter distributions, white matter (WM) maps and probabilistic tractography are examined. The importance of prospective correction during data acquisition is demonstrated. In contrast to some previous studies, results also show that the inclusion of retrospective processing also improved ellipsoid fits and both the sensitivity and specificity of group tractographic results, even for navigated data. Matches with anatomical WM maps are highest throughout the brain for data that have been both navigated and processed using TORTOISE. The inclusion of both prospective and retrospective motion correction with EPI distortion correction is important for DTI analysis, particularly when studying subject populations that are prone to motion. Hum Brain Mapp 37:4405-4424, 2016. © 2016 Wiley Periodicals, Inc.

Keywords: diffusion tensor imaging; echo planar imaging volumetric navigator; fractional anisotropy; motion correction; tractography.


Figures

Figure 1
Figure 1
Normalized distributions of FA values in the WB (top) and in T1w‐WM (bottom) for all six subjects (A–F). In the WB cases Standard and TOP distributions tended to be the most rightward. In T1w‐WM TORT results were the least left‐shifted, suggesting that these sets had the least amount of smoothing. [Color figure can be viewed at http://wileyonlinelibrary.com]
Figure 2
Figure 2
Normalized distributions of bias (top) and standard deviation (bottom) of the angular uncertainty, Δe 12 (i.e., the first eigenvector projected along the second eigenvector), in T1w‐WM for the same subjects shown in Figure 1. [Color figure can be viewed at http://wileyonlinelibrary.com]
Figure 3
Figure 3
Dice coefficients of overlap between WM masks defined using FA and T1w images (same subjects as Figs. 1 and 2). Individual Dice coefficients were calculated for each coronal slice in the overlaid volumes. Dice values are relatively constant across the volumes, with vNav_TORT consistently showing the highest values. [Color figure can be viewed at http://wileyonlinelibrary.com]
Figure 4
Figure 4
Comparison of FA (>0.2) and T1w (segmented) WM for subject “F,”, whose Dice coefficient curves were similar across acquisition and processing pipelines (Fig. 3). Locations where the FA‐WM overlaps with T1w‐WM are shown in red, with false positive and negative FA‐WM shown in green and blue, respectively. In each panel, the axial slices are arranged inferior (left) to superior (right). Standard images tend to show a relatively larger number of false positives. [Color figure can be viewed at http://wileyonlinelibrary.com]
Figure 5
Figure 5
Comparison of FA (>0.2) and T1w (segmented) WM for subject C, whose Dice coefficient curves showed significant variation among the acquisition and processing pipelines (Fig. 3). Locations where the FA‐WM overlaps with T1w‐WM are shown in red, with false positive and negative FA‐WM shown in green and blue, respectively. In each panel the axial slices are arranged inferior (left) to superior (right). Standard TOP images show systematic differences in WM locations. [Color figure can be viewed at http://wileyonlinelibrary.com]
Figure 6
Figure 6
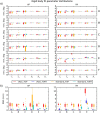
(a) Rigid body registration parameters (translation in mm and rotation in deg) for each subject as estimated by TOP and TORT programs. Results for each phase encoding direction (AP and PA) are shown separately. The mean of each distribution is shown with a black line, the color block covers the 25–75% interval, whiskers extend to 1.5× the interquartile range, and dots represent outliers. In nearly every case, the TOP distributions have the largest magnitude of mean and widest extent. (b) Distributions of the overall RMS deviations of the registration parameters are shown for each subject. Subjects “C,” “D,” and “E” exhibit the largest values; in the latter case, large registration values appear even in the navigated data set. [Color figure can be viewed at http://wileyonlinelibrary.com]
Figure 7
Figure 7
Overall RMS deviations of the rigid body subject motion parameters, as estimated by the navigator during data acquisition. Results for each phase encoding direction (AP and PA) are shown separately. Values for all acquired volumes are shown in red; volumes in black were kept after accounting for reacquisition (i.e., eliminating repetitions due either to excessive motion or post‐acquisition protocol; see Methods); and the set of cyan volumes were used for analysis after visual examination for dropout slices. Subjects “C” and “E” exhibited the largest amount of motion, with several outliers filtered out from each set for final analysis. [Color figure can be viewed at http://wileyonlinelibrary.com]
Figure 8
Figure 8
The top panel shows a map of the target ROIs (based on the DMN) in the same slice, with each cortex labeled with a unique color: medial orbitofrontal (red), posterior cingulate (green), precuneus (blue), and inferior parietal (violet). To examine the similarities and differences in tractographic results for each processing method, the mask of each subject's estimated intra‐network WM has been summed across the group in panels “a‐d.” Regions in the summation maps where all group members exhibited WM are shown in red, and regions where only one subject had WM are in blue. Locations of high sensitivity for individual methods are highlighted with magenta arrows. In each panel, sagittal images are arranged medial (left) to lateral (right). Quantitative comparisons of the summed masks are provided in Figure 9. [Color figure can be viewed at http://wileyonlinelibrary.com]
Figure 9
Figure 9
Quantitative comparisons of “summation maps” of tractographic results. All masks of intranetwork connections were mapped from each diffusion space to the Haskins pediatric template to create “summation maps” (shown in Fig. 8). Panel A shows the number of tracked voxels shared across a given percent of the group are shown. Panel B shows the same values, scaled by the number of nonzero values in the summation mask. [Color figure can be viewed at http://wileyonlinelibrary.com]
Figure A1
Figure A1
An example of the inversion of the IRCT method for generating a T2w‐like image from a T1w volume. The brightness values of the original volume (A) are ceilinged (B) based on the WB distribution. (C) WM and GM tissues are each intensity normalized to approximately uniform intensities. (D) The intracranial volume is extracted, and (E) the linear brightness inversion is performed. The resulting volume has similar relative tissue contrast to an acquired T2w volume, as well as to a standard DTI b 0 (a similar slice is shown in panel F).
Figure A2
Figure A2
The T2w and inverse T1w data sets used as anatomical references in TORTOISE are shown in the top rows, respectively (axial slices, left = left). The bottom two rows show each of the average b 0 volumes at the same locations after being processed by TORTOISE, and these volumes show a very high degree of similarity.
Figure A3
Figure A3
Normalized distributions of DTI parameters after TORTOISE processing are shown from across the WB (top row) and within the T1‐segmented WM (bottom row). The results of TORTOISE processing using the inverted T1w volume (red) and the standard T2w volume (black) are nearly identical. [Color figure can be viewed at http://wileyonlinelibrary.com]
Figure A4
Figure A4
Axial slices (left = left) compare the overlap of WM masks derived from post‐TORTOISE DTI data, where FA > 0.2, for pipelines using either a standard T2w volume or an inverted T1w volume. The volumes show a high degree of overlap (red) across the cortex and much of the brain. Small differences (green and blue) are noticeable mainly within one voxel of the GM‐WM boundary, and in the most inferior slices, as well as in posterior regions. [Color figure can be viewed at http://wileyonlinelibrary.com]
Figure A5
Figure A5
Dice coefficients showing the overlap in WM masks defined using DTI parameters (where FA > 0.2) and T1w segmentation. The Dice coefficient was calculated separately for each coronal slice in the aligned volumes, in order to show any local changes. The results of processing using TORTOISE and either a standard T2w volume (red) or an inverted T1w volume (black) are uniformly high and similar to each other across the brain, with the greatest difference apparent at the posterior‐most slices of the brain. [Color figure can be viewed at http://wileyonlinelibrary.com]

Similar articles

Cited by

References

    1. Aksoy M, Liu C, Moseley ME, Bammer R (2008): Single‐step nonlinear diffusion tensor estimation in the presence of microscopic and macroscopic motion. Magn Reson Med 59: 1138–1150. - PMC - PubMed
    1. Alhamud A, Tisdall MD, Hess AT, Hasan KM, Meintjes EM, van der Kouwe AJW (2012): Volumetric navigators for real‐time motion correction in diffusion tensor imaging. Magn Reson Med 68:1097–1108. - PMC - PubMed
    1. Alhamud A, Taylor PA, Laughton B, Hasan KM, van der Kouwe AJW, Meintjes EM (2015): Motion artifact reduction in pediatric diffusion tensor imaging using fast prospective correction. J Magn Reson Imaging 41:1353–1364. - PMC - PubMed
    1. Alhamud A, Taylor PA, van der Kouwe AJW, Meintjes EM (2016): Real‐time measurement and correction of both B0 changes and subject motion in diffusion tensor imaging using a double volumetric navigated (DvNav) sequence. NeuroImage 1;126:60–71. - PMC - PubMed
    1. Andersson JL, Skare S, Ashburner J (2003): How to correct susceptibility distortions in spin‐echo echo‐planar images: Application to diffusion tensor imaging. Neuroimage 20:870–888. - PubMed

Publication types

LinkOut - more resources