

Time-lapse lens-free imaging of cell migration in diverse physical microenvironments
- PMID: 27436197
- PMCID: PMC4987231
- DOI: 10.1039/c6lc00860g
Time-lapse lens-free imaging of cell migration in diverse physical microenvironments
Abstract
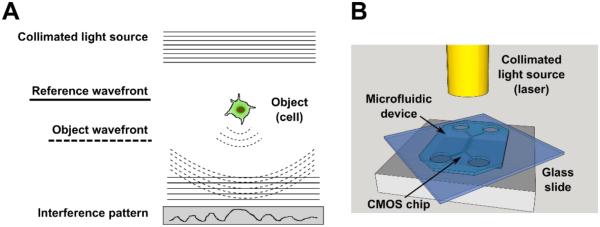
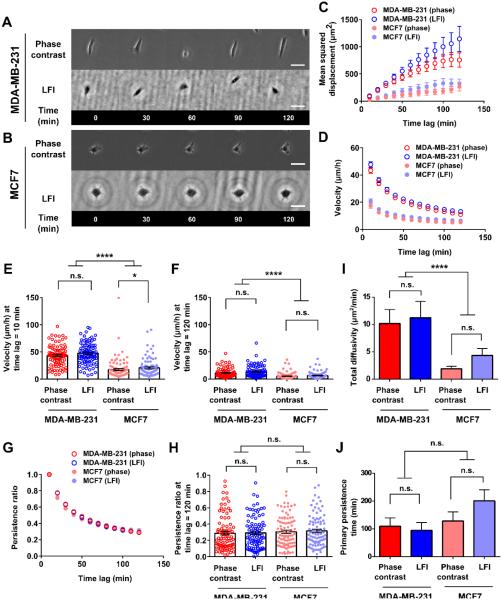
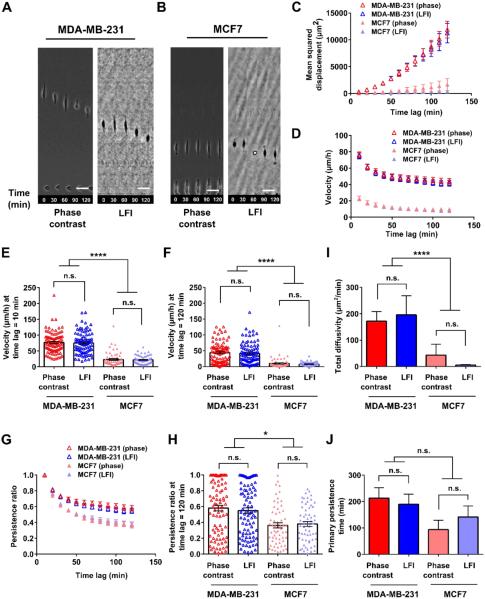
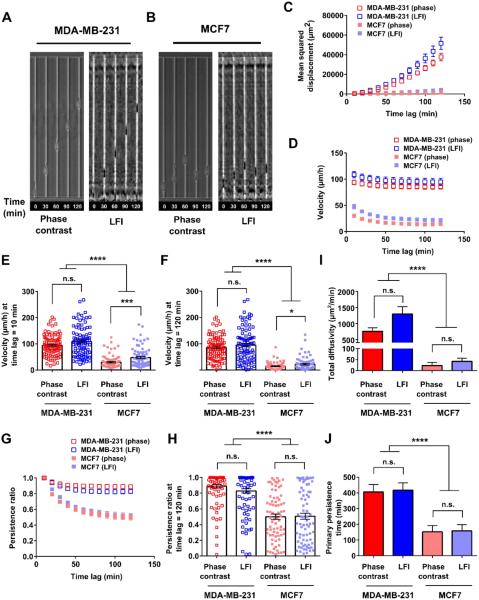
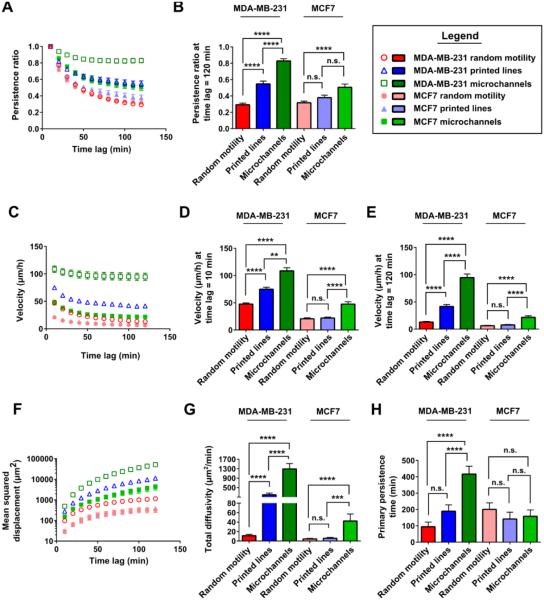
Time-lapse imaging of biological samples is important for understanding complex (patho)physiological processes. A growing number of point-of-care biomedical assays rely on real-time imaging of flowing or migrating cells. However, the cost and complexity of integrating experimental models simulating physiologically relevant microenvironments with bulky imaging systems that offer sufficient spatiotemporal resolution limit the use of time-lapse assays in research and clinical settings. This paper introduces a compact and affordable lens-free imaging (LFI) device based on the principle of coherent in-line, digital holography for time-lapse cell migration assays. The LFI device combines single-cell resolution (1.2 μm) with a large field of view (6.4 × 4.6 mm(2)), thus rendering it ideal for high-throughput applications and removing the need for expensive and bulky programmable motorized stages. The set-up is so compact that it can be housed in a standard cell culture incubator, thereby avoiding custom-built stage top incubators. LFI is thoroughly benchmarked against conventional live-cell phase contrast microscopy for random cell motility on two-dimensional (2D) surfaces and confined migration on 1D-microprinted lines and in microchannels using breast adenocarcinoma cells. The quality of the results obtained by the two imaging systems is comparable, and they reveal that cells migrate more efficiently upon increasing confinement. Interestingly, assays of confined migration more readily distinguish the migratory potential of metastatic MDA-MB-231 cells from non-metastatic MCF7 cells relative to traditional 2D migration assays. Altogether, this single-cell migration study establishes LFI as an elegant and useful tool for live-cell imaging.
Figures
Similar articles
-
Assembly and Use of a Microfluidic Device to Study Cell Migration in Confined Environments.Methods Mol Biol. 2018;1840:101-118. doi: 10.1007/978-1-4939-8691-0_10. Methods Mol Biol. 2018. PMID: 30141042
-
High-resolution cost-effective compact portable inverted light microscope.J Microsc. 2019 Mar;273(3):199-209. doi: 10.1111/jmi.12775. Epub 2018 Dec 17. J Microsc. 2019. PMID: 30561003
-
Wide-field computational imaging of pathology slides using lens-free on-chip microscopy.Sci Transl Med. 2014 Dec 17;6(267):267ra175. doi: 10.1126/scitranslmed.3009850. Sci Transl Med. 2014. PMID: 25520396
-
Cancer cell motility: lessons from migration in confined spaces.Nat Rev Cancer. 2017 Feb;17(2):131-140. doi: 10.1038/nrc.2016.123. Epub 2016 Dec 2. Nat Rev Cancer. 2017. PMID: 27909339 Free PMC article. Review.
-
Roadmap on digital holography [Invited].Opt Express. 2021 Oct 25;29(22):35078-35118. doi: 10.1364/OE.435915. Opt Express. 2021. PMID: 34808951 Review.
Cited by
-
Cancer cells display increased migration and deformability in pace with metastatic progression.FASEB J. 2020 Jul;34(7):9307-9315. doi: 10.1096/fj.202000101RR. Epub 2020 May 28. FASEB J. 2020. PMID: 32463148 Free PMC article.
-
Effect of Proinflammatory S100A9 Protein on Migration and Proliferation of Microglial Cells.J Mol Neurosci. 2023 Dec;73(11-12):983-995. doi: 10.1007/s12031-023-02168-1. Epub 2023 Nov 10. J Mol Neurosci. 2023. PMID: 37947991
-
Continuous Real-Time Motility Analysis of Acanthamoeba Reveals Sustained Movement in Absence of Nutrients.Pathogens. 2021 Aug 6;10(8):995. doi: 10.3390/pathogens10080995. Pathogens. 2021. PMID: 34451459 Free PMC article.
-
Adhesion, metastasis, and inhibition of cancer cells: a comprehensive review.Mol Biol Rep. 2024 Jan 22;51(1):165. doi: 10.1007/s11033-023-08920-5. Mol Biol Rep. 2024. PMID: 38252369 Free PMC article. Review.
-
Method for simultaneous tracking of thousands of unlabeled cells within a transparent 3D matrix.PLoS One. 2022 Jun 24;17(6):e0270456. doi: 10.1371/journal.pone.0270456. eCollection 2022. PLoS One. 2022. PMID: 35749549 Free PMC article.
References
-
- Dunn GA, Jones GE. Nature reviews. Molecular cell biology. 2004;5:667–672. - PubMed
-
- Coutu DL, Schroeder T. Journal of cell science. 2013;126:3805–3815. - PubMed
-
- Frigault MM, Lacoste J, Swift JL, Brown CM. Journal of cell science. 2009;122:753–767. - PubMed
-
- Paddock S. BioTechniques. 2001;30:283–286. 288-289. - PubMed
-
- Stephens DJ, Allan VJ. Science (New York, N.Y.) 2003;300:82–86. - PubMed
Publication types
MeSH terms
Grants and funding
LinkOut - more resources
Full Text Sources
Other Literature Sources
Medical
Miscellaneous