. 2016 Jul 20:6:29637.
doi: 10.1038/srep29637.

Hypoxia-mediated impaired erythrocyte Lands' Cycle is pathogenic for sickle cell disease

Affiliations

Hypoxia-mediated impaired erythrocyte Lands' Cycle is pathogenic for sickle cell disease

Hongyu Wu et al. Sci Rep. .

Abstract

Although Lands' cycle was discovered in 1958, its function and cellular regulation in membrane homeostasis under physiological and pathological conditions remain largely unknown. Nonbiased high throughput metabolomic profiling revealed that Lands' cycle was impaired leading to significantly elevated erythrocyte membrane lysophosphatidylcholine (LysoPC) content and circulating and erythrocyte arachidonic acid (AA) in mice with sickle cell disease (SCD), a prevalent hemolytic genetic disorder. Correcting imbalanced Lands' cycle by knockdown of phospholipase 2 (cPLA2) or overexpression of lysophosphatidycholine acyltransferase 1 (LPCAT1), two key enzymes of Lands' cycle in hematopoietic stem cells, reduced elevated erythrocyte membrane LysoPC content and circulating AA levels and attenuated sickling, inflammation and tissue damage in SCD chimeras. Human translational studies validated SCD mouse findings and further demonstrated that imbalanced Lands' cycle induced LysoPC production directly promotes sickling in cultured mouse and human SCD erythrocytes. Mechanistically, we revealed that hypoxia-mediated ERK activation underlies imbalanced Lands' cycle by preferentially inducing the activity of PLA2 but not LPCAT in human and mouse SCD erythrocytes. Overall, our studies have identified a pathological role of imbalanced Lands' cycle in SCD erythrocytes, novel molecular basis regulating Lands' cycle and therapeutic opportunities for the disease.


Figures
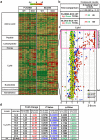
Figure 1
Figure 1. Metabolomic screening of mouse whole blood and plasma in WT and SCD mice.
(a) Heat map showing the alteration of metabolite concentration of 8 groups (including amino acids, carbohydeates, cofactors, TCA cycle, lipids, nucleosides and metabolites, peptides and xenobiotics) shades of green and red represent an increase and decrease in metabolite concentration respectively; relative to the median metabolite level (see color scale). (b) Summary of significant altered metabolites in SCD mice compared to WT mice. (c) Z-score quantification of lipids detected in whole blood and plasma of both WT and SCD Tg mice (n = 4–6). Among all lipids detected, lysophospholipids were the most significantly elevated in whole blood of SCD Tg mice compared with that in WT mice (n = 6). AA was elevated in both plasma and whole blood of SCD Tg mice (n = 4–6). (d) Profiling of Lysophospholipids and AA detected in whole blood and plasma of both control and SCD Tg mice (n = 4–6). q-value is a measure of false discovery rate.
Figure 2
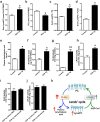
Figure 2. Biochemical analyses revealed increased lysophosphatidylcholine levels in the erythrocytes and increased arachidonic acid in plasma and erythrocytes of SCD mice due to imbalanced Lands’ cycle.
(a–d) LysoPC (a), PC level (b), the ratio of LysoPC/PC (c) and the percentage of LysoPC/PL (d) in erythrocyte membrane preparations from control and SCD Tg mice. Error bars, SEM; n = 6 per group. (e,f) Plasma and erythrocyte AA levels were significantly increased in SCD Tg mice compared to that of controls. Error bars, SEM; n = 6 per group. (g) PLA2 activity was measured in the erythrocytes from control and SCD Tg mice. Error bars, SEM; n = 10 per group *P < 0.05 versus controls. **P < 0.01 versus controls. (h) LPCAT activity was detected in the erythrocytes from control and SCD Tg mice. Error bars, SEM; n = 8 per group. (i,j) PLA2 activity (i) and LPCAT activity (j) were measured in purified mature erythrocytes and reticulocytes from SCD Tg mice, respectively. Data are expressed as Mean ± SEM; n = 5 in each group. (k) Imbalanced Lands’ cycle favored the production of LysoPC generation from PC due to overly active PLA2s compared to LPCAT activity in SCD erythrocytes. PLA2s hydrolyze PC to release LysoPC and AA, while LPCAT catalyzes the reacylation at the sn -2 position of LysoPC into PC by using acyl-CoA.
Figure 3
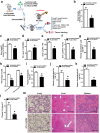
Figure 3. shRNA specific knockdown of cPLA2 in HSCs of BMT SCD chimeras attenuated sickling, hemolysis and inflammation.
(a) Schematic flow of mouse treatment strategy and experimental procedure. (b–f) PLA2 activity (b), LysoPC content (c), PC content (d), the ratio of LysoPC/PC (e) and the percentage of LysoPC/PL (f) were quantified in the erythrocytes from SCD chimeras mice with scrambled shRNA or cPLA2 shRNA. Error bars, SEM; n = 5–7 per group. (g) Circulating AA was significantly decreased in SCD chimeras with specific cPLA2 knockdown. (h) Percentages of sickled cells and reticulocytes were significantly reduced in the SCD chimeras with HSC-specific cPLA2 knockdown. (i–l) cPLA2 knockdown in HSCs of BMT SCD chimeras decreased plasma hemoglobin levels (i), leukotriene B4 (j), prostaglandin E2 (k) and reduced circulating IL-6 (l). Values shown represent the mean ± SEM (n = 5–7). (m) H&E staining of spleens, livers, and lungs of SCD chimeras with HSC-specific cPLA2 knockdown and controls. *P < 0.05 versus SCD chimeras with BMCs infected with recombinant lentivirus encoding scrambled shRNA.
Figure 4
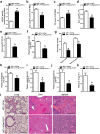
Figure 4. Overexpression of LPCAT1 in HSCs of BMT SCD chimeras attenuates sickling, hemolysis, inflammation and tissue damage.
(a–e) LPCAT activity (a), LysoPC content (b), PC content (c), the ratio of LysoPC/PC (d) and the percentage of LysoPC/PL (e) were quantified in the erythrocytes from SCD chimeras with overexpression of LPCAT1 or control vector. Error bars, SEM; n = 6 per group. (f) Overexpression of LPCAT1 in HSCs of BMT SCD chimeras significantly decreased plasma AA levels. (g) Percentages of sickle cells and reticulocytes were significantly reduced in the SCD chimeras overexpressing LPCAT1 in HSCs. (h–k) Overexpression of LPCAT1 in HSCs decreased plasma hemoglobin (h), leukotriene B4 (i), prostaglandin E2 (j) and IL-6 (k) levels in SCD chimeras. Values shown represent the mean ± SEM (n = 6). (l) Hematoxylin and eosin stain shows histological changes in spleen, liver, and lung tissues of SCD chimeras 16 weeks after BMT. Scale bar, 10 μm. Values shown represent the mean ± SEM, n = 6 per group. *P < 0.05 versus SCD chimeras with BMCs infected with recombinant lentivirus packaging control vector.
Figure 5
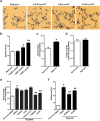
Figure 5. Lysophosphatidylcholine directly promotes hypoxia-induced sickling in cultured primary SCD mouse erythrocytes and hypoxia preferentially induces PLA2 but not LPCAT via MEK/ERK signaling.
(a) Representative blood smears following treatment of blood from SCD Tg mice with Methanol (vehicle) or different concentration of LysoPC (2.5 μM, 5 μM and 10 μM as indicated) under 4% oxygen condition for 2 hours. Scale bar, 20 μm. (b) Quantification of (a). Data were represented as the mean percentage of sickle cells ± SEM. n = 3. *P < 0.05 and **P < 0.01 versus cultured SCD erythrocytes treated with DMSO or methanol. (c,d) PLA2 activity (c) and LPCAT activity (d) were measured in the cultured SCD mouse erythrocytes following 2 hours under normal air or 4% oxygen conditions. Error bars, SEM; n = 6 per group. *P < 0.05 versus SCD mouse erythrocytes under normoxic condition. (e) PLA2 activity was measured in primary cultured SCD mouse erythrocytes treated with DMSO, PKC inhibitor Go6976 (1 μM), MEK inhibitors PD98059 (20 μM) and U0126 (10 μM), PKA inhibitor H-89 (10 μM) and AMPK inhibitor compound C (10 μM) under 4% oxygen condition for 2 hours. PLA2 activity in SCD erythrocytes treated with DMSO under normoxic condition was used as a basal control. Error bars, SEM; n = 5 per group. (f) Quantification of blood smear analysis of cultured SCD mouse erythrocytes treated with DMSO or two different MEK inhibitors. Data are represented as the mean percentages of sickle cells ± SEM (n = 5). *P < 0.05 versus SCD mouse erythrocytes treated with DMSO under normoxia. **P < 0.05 relative to DMSO-treated group under hypoxia condition.
Figure 6
Figure 6. Imbalanced Lands’ cycles is seen in SCD patients and contributes to hypoxia-induced sickling by preferentially inducing PLA2 activity in MEK/ERK-dependent manner.
(a,b) Measurement of PLA2 activity (a) and LPCAT activity (b) in the erythrocytes from healthy volunteers (control, n = 15) and patients with SCD (n = 22). (cf) LysoPC content (c), PC content (d), the ratio of LysoPC/PC (e) and the percentage of LysoPC/PL (f) were quantified in the erythrocytes of controls and individuals with SCD. Error bars, SEM; n = 8. *P < 0.05 versus control, **P < 0.01 versus control. (g) Quantification of blood smear of human SCD erythrocytes treated with DMSO or different dosage of cPLA2 inhibitors, MAFP and Pyrrophenone or LPCAT inhibitor, CI-976 under 4% oxygen condition for 2 hours, respectively. (h) Quantification of blood smears of human SCD erythrocytes treated with methanol (vehicle) or different concentrations of LysoPC under 4% oxygen conditions for 2 hours. Error bars, SEM; n = 6. *P < 0.05, **P < 0.01 versus controls. (i) Measurement of PLA2 activity in human SCD erythrocytes treated with DMSO or two different MEK inhibitors, PD98059 (20 μM) and U0126 (10 μM) under hypoxic condition, respectively. (j) Quantification of blood smear analysis of human SCD erythrocytes treated with DMSO or two different MEK inhibitors. Data are represented as the mean percentages of sickled cells ± SEM (n = 6). *P < 0.05 versus SCD Tg mice treated with DMSO under normoxia. **P < 0.05 relative to DMSO-treated group under hypoxia condition. (k) Working Model: hypoxia preferentially induced elevation of activity of erythrocyte cPLA2 but not LPACT1 via MEK/ERK signaling cascade results in increased generation of erythrocyte LysoPLs and free fatty acids, in particular LysoPC and AA, and subsequently increased release of AA to the circulation in SCD. Under hypoxia, increased erythrocyte membrane LysoPC and deoxygenated HbS work together to promote sickling. Moreover, elevated circulating AA leads to increased production of multiple inflammatory mediators including leukotrienes and prostaglandins. As such, imbalanced erythrocyte Lands’ cycle-mediated elevated LysoPC and AA are pathogenic to induce sickling, inflammation and tissue damage. Thus, correcting impaired Lands’ cycle is a novel therapeutic approach for SCD management.

Similar articles

Cited by

References

    1. Lands W. E. Metabolism of glycerolipides; a comparison of lecithin and triglyceride synthesis. J Biol Chem 231, 883–888 (1958). - PubMed
    1. Renooij W., Van Golde L. M., Zwaal R. F., Roelofsen B. & Van Deenen L. L. Preferential incorporation of fatty acids at the inside of human erythrocyte membranes. Biochim Biophys Acta 363, 287–292 (1974). - PubMed
    1. Aufradet E. et al.. Hypoxia/reoxygenation stress increases markers of vaso-occlusive crisis in sickle SAD mice. Clin Hemorheol Microcirc 54, 297–312, doi: 10.3233/CH-131735 (2013). - DOI - PubMed
    1. Connor W. E. et al.. Abnormal phospholipid molecular species of erythrocytes in sickle cell anemia. J Lipid Res 38, 2516–2528 (1997). - PubMed
    1. Lubin B., Chiu D., Bastacky J., Roelofsen B. & Van Deenen L. L. Abnormalities in membrane phospholipid organization in sickled erythrocytes. J Clin Invest 67, 1643–1649 (1981). - PMC - PubMed

Publication types

Substances