

Chronic effects of temperature on mortality in the Southeastern USA using satellite-based exposure metrics
- PMID: 27436237
- PMCID: PMC4951799
- DOI: 10.1038/srep30161
Chronic effects of temperature on mortality in the Southeastern USA using satellite-based exposure metrics
Abstract
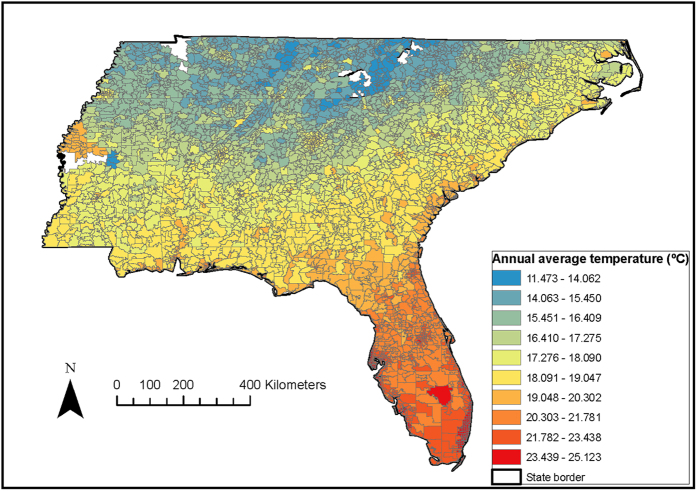
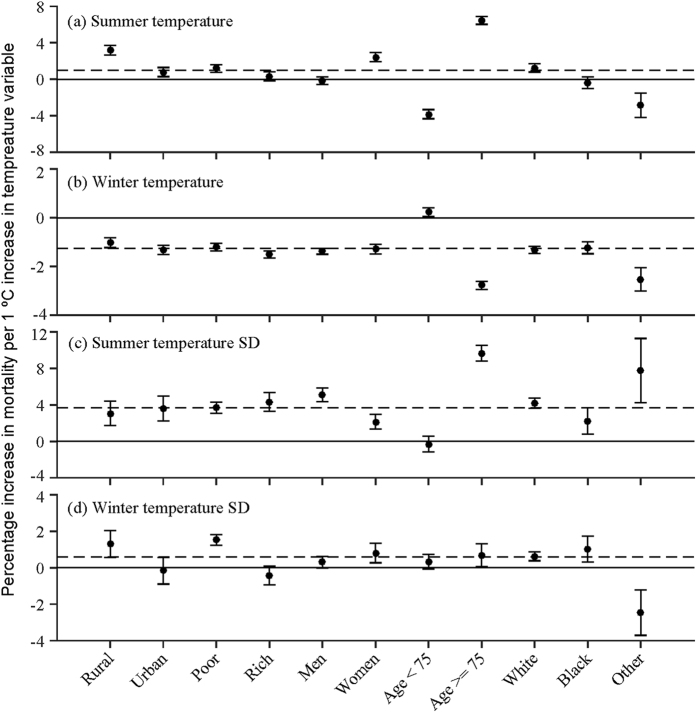
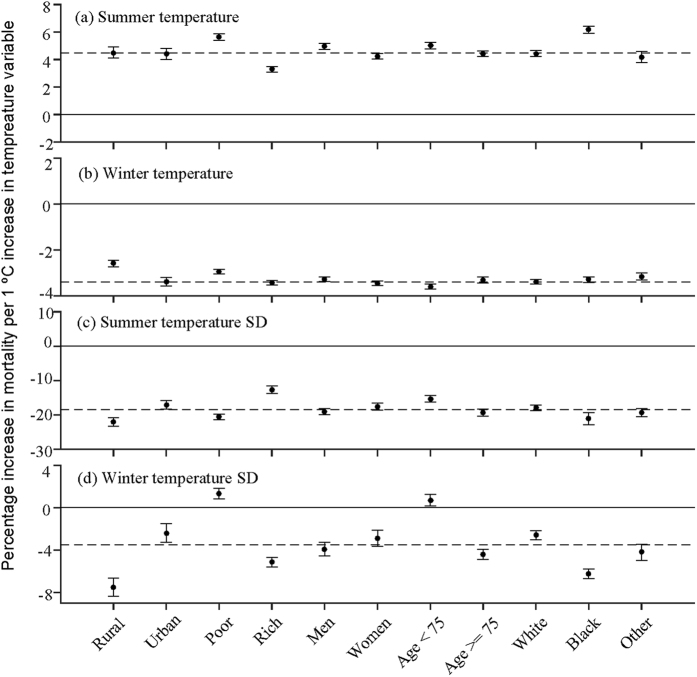
Climate change may affect human health, particularly for elderly individuals who are vulnerable to temperature changes. While many studies have investigated the acute effects of heat, only a few have dealt with the chronic ones. We have examined the effects of seasonal temperatures on survival of the elderly in the Southeastern USA, where a large fraction of subpopulation resides. We found that both seasonal mean temperature and its standard deviation (SD) affected long-term survival among the 13 million Medicare beneficiaries (aged 65+) in this region during 2000-2013. A 1 °C increase in summer mean temperature corresponded to an increase of 2.5% in death rate. Whereas, 1 °C increase in winter mean temperature was associated with a decrease of 1.5%. Increases in seasonal temperature SD also influence mortality. We decomposed seasonal mean temperature and its temperature SD into long-term geographic contrasts between ZIP codes and annual anomalies within ZIP code. Effect modifications by different subgroups were also examined to find out whether certain individuals are more vulnerable. Our findings will be critical to future efforts assessing health risks related to the future climate change.
Figures
References
-
- Stocker T. et al. IPCC, 2013: climate change 2013: the physical science basis. Contribution of working group I to the fifth assessment report of the intergovernmental panel on climate change (2013).
-
- Melillo J. M., Richmond T. T. & Yohe G. Climate change impacts in the United States. Third National Climate Assessment (2014).
-
- Patz J. A., Campbell-Lendrum D., Holloway T. & Foley J. A. Impact of regional climate change on human health. Nature 438, 310–317 (2005). - PubMed
Publication types
MeSH terms
Grants and funding
LinkOut - more resources
Full Text Sources
Other Literature Sources
Medical
