. 2016 Sep 19;44(16):7817-29.
doi: 10.1093/nar/gkw648. Epub 2016 Jul 19.

Length heterogeneity at conserved sequence block 2 in human mitochondrial DNA acts as a rheostat for RNA polymerase POLRMT activity

Affiliations

Length heterogeneity at conserved sequence block 2 in human mitochondrial DNA acts as a rheostat for RNA polymerase POLRMT activity

Benedict G Tan et al. Nucleic Acids Res. .

Abstract

The guanine (G)-tract of conserved sequence block 2 (CSB 2) in human mitochondrial DNA can result in transcription termination due to formation of a hybrid G-quadruplex between the nascent RNA and the nontemplate DNA strand. This structure can then influence genome replication, stability and localization. Here we surveyed the frequency of variation in sequence identity and length at CSB 2 amongst human mitochondrial genomes and used in vitro transcription to assess the effects of this length heterogeneity on the activity of the mitochondrial RNA polymerase, POLRMT. In general, increased G-tract length correlated with increased termination levels. However, variation in the population favoured CSB 2 sequences which produced efficient termination while particularly weak or strong signals were avoided. For all variants examined, the 3' end of the transcripts mapped to the same downstream sequences and were prevented from terminating by addition of the transcription factor TEFM. We propose that CSB 2 length heterogeneity allows variation in the efficiency of transcription termination without affecting the position of the products or the capacity for regulation by TEFM.


Figures

Figure 1.
Figure 1.
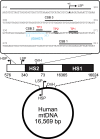
The DNA sequence of the human mitochondrial NCR encompassing the light strand promoter and Conserved Sequence Blocks 1, 2 and 3. The control region of human mtDNA is indicated, with the locations of LSP, HSP, OH, and HS1 and HS2 highlighted. The nucleotide from 211 to 450 of the revised Cambridge Reference Sequence (rCRS) (47), are shown, with the locations of the LSP and of CSB 1, 2 and 3 highlighted (47). The locations of the 3′ ends of the transcription products observed here are shown (TP1, 2 and 3). We analysed length heterogeneity due to changes to the G-tract between nucleotides 303–315, with the remainder of the sequence remaining the same.
Figure 2.
Figure 2.
Distribution of length heterogeneity in sequenced NCRs of human mtDNA and the effect on the levels of POLRMT transcription termination. (A) Distribution of adenine-interrupted discontinuous CSB 2 G-tract hits from searches of complete and partial human mtDNA sequences deposited in GenBank (total of 45 197). (B) Number of hits from panel A summed according to total number of guanine residues. (C) In vitro transcription assay. The top panel cartoon shows the linear DNA substrate and the sizes of the run off (RO) and the three transcription products (TP1, TP2 or TP3) that can appear due to CSB 2 (yellow box). The black box represents the TFAM binding site upstream of the light strand promoter (LSP). The lower panel shows a representative mini-gel with the quantified percentage of total TP shown below each lane. The bands at the top of the gel are material retained in the wells. (D) The average percentage of total TP (TP1 + TP2 + TP3) measured for different CSB 2 sequences (N = 3). The black lines show the extent of sequences observed in panel A. Representative transcription mini-gels of all variants and bar graphs of the quantified data are shown in Supplementary Figures S5 and S6. E. Cumulative correlation plot of occupied variants from panel A and average TP percentages for those variants from panel D. Most of the occupied variants produced a total TP in vitro between 17% and 43%.
Figure 3.
Figure 3.
The influence of the position of the adenine of discontinuous CSB 2 sequences. (A) Definition of position of the middle adenine. Examples of G-tracts with even (G14) or odd (G13) numbers of guanines are shown. See text for full details. (B) Percentage of TP as a function of position of the adenine for discontinuous G-tracts of 9–17 residues. Data taken from Figure 2D and Supplementary Figure S6 (N = 3, error bars S.D.). (C) Data from Figure 2A plotted as a function of position of the adenine. Colours represent the occupied variants with G-tract lengths as in panel (B).
Figure 4.
Figure 4.
Comparison of discontinuous and continuous CSB 2 sequences. (A) Distribution of continuous CSB 2 G-tract hits from searches of complete and partial human mtDNA deposited in GenBank. (B) Representative mini-gel and the average percentage of total TP (N = 3, error bars S.D.) measured for the discontinuous CSB 2 sequences G9AG6 (WT), G9TG6 (A>T) and G9CG6 (A>C), and the continuous CSB 2 sequence G16 (A>G). (C) Representative mini-gel for transcription of discontinuous CSB 2 sequences G9 to G18. (D) The average percentage of total TP (N = 3, error bars S.D.) measured for the continuous CSB 2 sequences G9 to G18, plotted as a function of total number of guanines alongside the discontinuous CSB 2 data from Figure 2D and Supplementary Figure S6 grouped according to the position of the adenine as defined in the main text and Figure 3A. Error bars are omitted from the discontinuous data for clarity.
Figure 5.
Figure 5.
Mapping the locations of transcription products as a function of length heterogeneity. (A) Varying the length of the second G-run of discontinuous sequences. (left panel) Denaturing sequencing gel showing the TP products from transcription reactions on DNA substrates where the first G-run was fixed at six guanines and the second G-run was varied as shown (full gel in Supplementary Figure S9). Approximate positions of TP1, TP2 and TP3 are shown (note that these move for each variant, as explained in Supplementary Figure S8. (right panel) Lanes from the gel were scanned and processed as described in Materials and Methods to convert pixel position up the lane to a linear sequence scale (x-axis of graph) and to normalise the intensities so that the maximum peak heights in each lane are the same (arbitrary y-axis of graph). Total TP percentages are shown in the brackets from Figure 2D and Supplementary Figure S6 (N = 3, errors S.D.). To compare the positions of the TP bands, sequences were aligned using the 3′ terminal guanines of the G-tracts (black vertical line). Sequences downstream of the G-tract are numbered according to the rCRS (47) (Figure 1). The uracil corresponding to transcription of T284 is marked by the thick grey dotted line to help guide the eye. (B) Varying the length of the first G-run of discontinuous sequences. Transcription reactions on DNA where the second G-run was fixed at seven guanines and the first G-run was varied as shown. Data treated as in panel A. Full gel in Supplementary Figure S9. (C) Varying the length of continuous sequences. Transcription reactions on DNA where the length of continuous sequences was varied as shown. Data treated as in panel A except that total TP percentages are from Figure 4D (N = 3, errors S.D.). Full gel in Supplementary Figure S9.
Figure 6.
Figure 6.
The role of sequences downstream of the CSB 2 G-tract in transcription termination. (A) Representative mini-gel and the average percentage of total TP (N = 3, error bars S.D.) measured for the discontinuous CSB 2 sequences G5AG7 (WT), and modifications to the G-tract (G>A) and/or the downstream sequences [TP, A6 or (UC)3]. Details of the sequence changes are shown in panel (B) and described in the main text. (B) Transcription reactions from panel A were also separated on a sequencing gel (Supplementary Figure S10) and the lanes scanned and processed as described in Figure 5. The 5′-T291TTTTTGTT283-3′ sequence is highlighted in yellow. Sequences changes are highlighted in red. The sequence downstream of the 5′-T291TTTTTGTT283-3′ sequence is highlighted in blue to emphasise that it moves relative to the G-core sequence in the ΔTP substrates. Percentages are the TP levels from panel (A) (N = 3, errors S.D.). (C) The effect of a three nucleotide insertion on the position of the transcription products. (cartoon) The CSB 2 variants G9AG8 and G10AG7 were mutated by insertion of AAA or CGU nucleotides 3′ to the G-tracts. Transcription reactions were separated on a sequencing gel (Supplementary Figure S10) and the lanes scanned and processed as described in Figure 5. Average percentages of total TP (N = 3, errors S.D.) were calculated from mini gels (Supplementary Figure S10). The positions of the main TP2 and TP1 bands are shown by grey lines, with the shift produced by the insertion mutations indicated by the blue arrows.
Figure 7.
Figure 7.
The influence of length heterogeneity on the anti-termination activity of the transcription factor TEFM. A representative mini-gel (A) and the average percentage of total TP (N = 3, error bars S.D.). (B) measured for the discontinuous CSB 2 sequences G6AG7, G10AG7 and G9AG11, and the continuous CSB 2 sequences G13 and G17, in the absence and presence of an equimolar concentration of TEFM dimer to POLRMT.

Similar articles

Cited by

References

    1. Holmes J.B., Akman G., Wood S.R., Sakhuja K., Cerritelli S.M., Moss C., Bowmaker M.R., Jacobs H.T., Crouch R.J., Holt I.J. Primer retention owing to the absence of RNase H1 is catastrophic for mitochondrial DNA replication. Proc. Natl. Acad. Sci. U.S.A. 2015;112:9334–9339. - PMC - PubMed
    1. Holt I.J., Reyes A. Human mitochondrial DNA replication. Cold Spring Harb. Perspect. Biol. 2012;4 doi:10.1101/cshperspect.a012971. - PMC - PubMed
    1. Kasiviswanathan R., Collins T.R., Copeland W.C. The interface of transcription and DNA replication in the mitochondria. Biochim. Biophys. Acta. 2012;1819:970–978. - PMC - PubMed
    1. Chang D.D., Clayton D.A. Priming of human mitochondrial DNA replication occurs at the light-strand promoter. Proc. Natl. Acad. Sci. U.S.A. 1985;82:351–355. - PMC - PubMed
    1. Wanrooij P.H., Uhler J.P., Shi Y., Westerlund F., Falkenberg M., Gustafsson C.M. A hybrid G-quadruplex structure formed between RNA and DNA explains the extraordinary stability of the mitochondrial R-loop. Nucleic Acids Res. 2012;40:10334–10344. - PMC - PubMed

Publication types

LinkOut - more resources