. 2016 Dec;73(24):4739-4748.
doi: 10.1007/s00018-016-2310-2. Epub 2016 Jul 19.

Loss of mutL homolog-1 (MLH1) expression promotes acquisition of oncogenic and inhibitor-resistant point mutations in tyrosine kinases

Affiliations

Loss of mutL homolog-1 (MLH1) expression promotes acquisition of oncogenic and inhibitor-resistant point mutations in tyrosine kinases

Lorraine Springuel et al. Cell Mol Life Sci. 2016 Dec.

Abstract

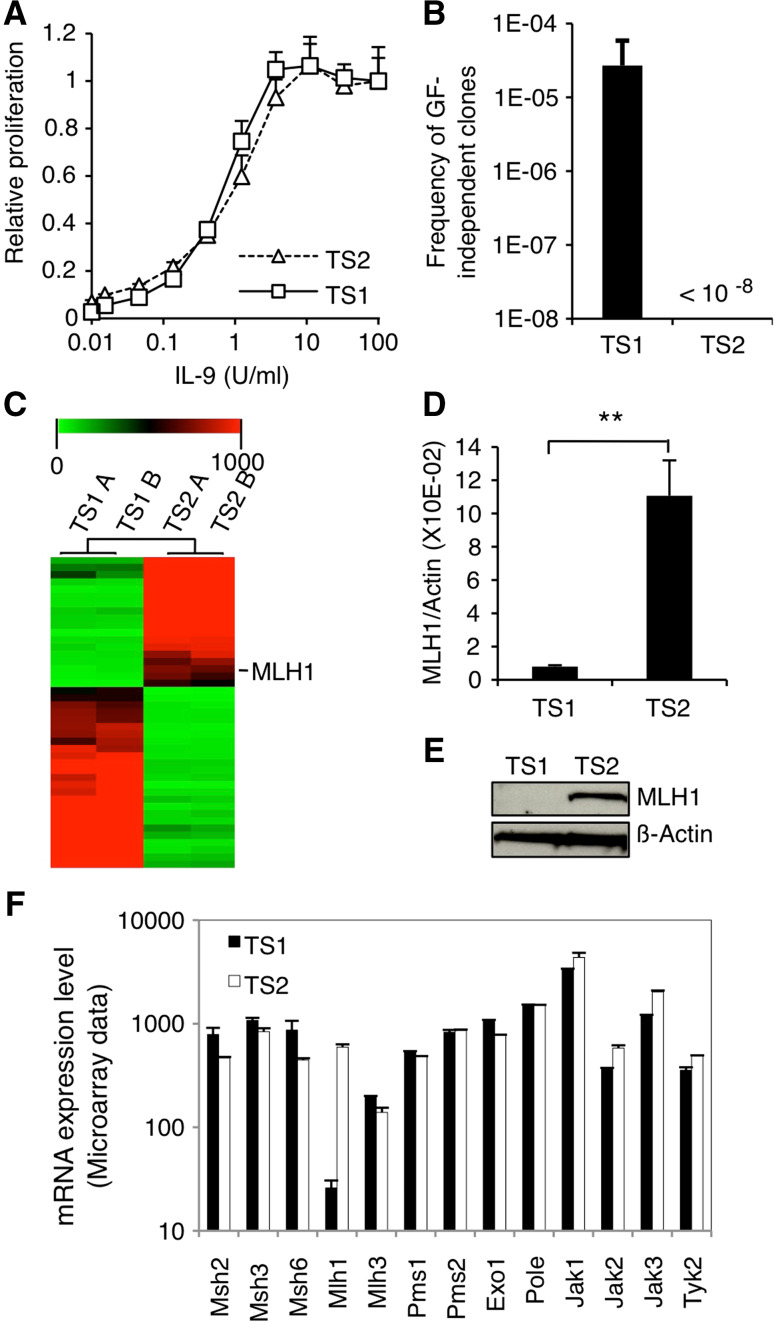
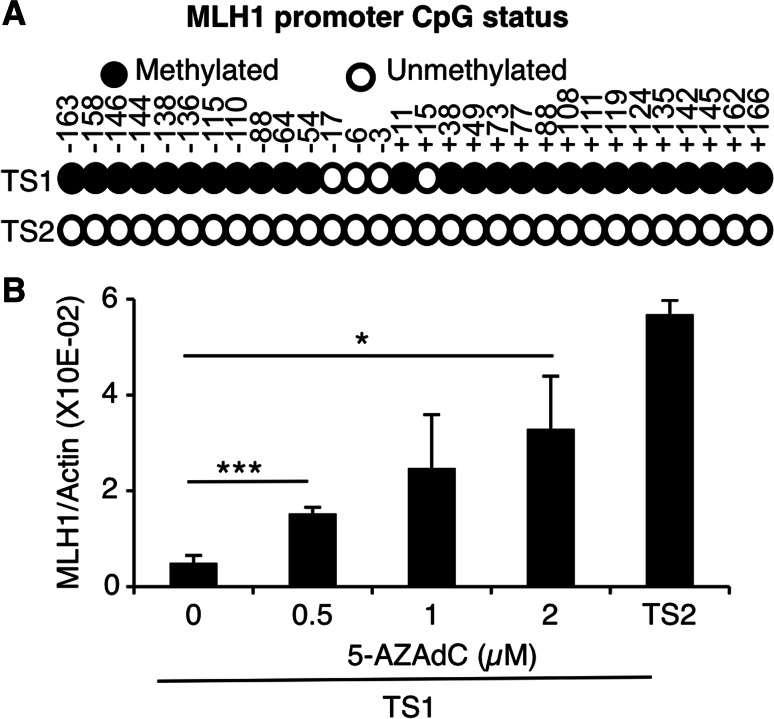
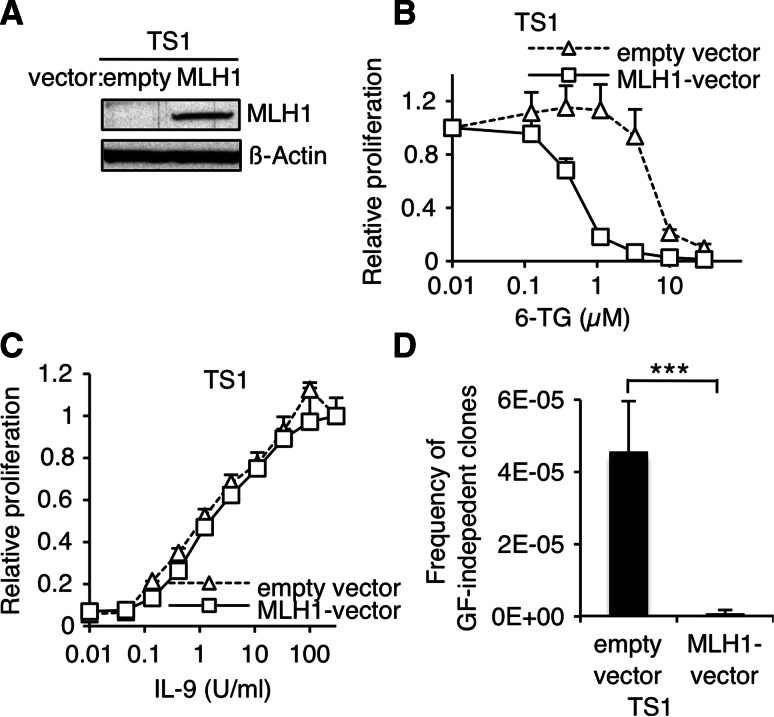
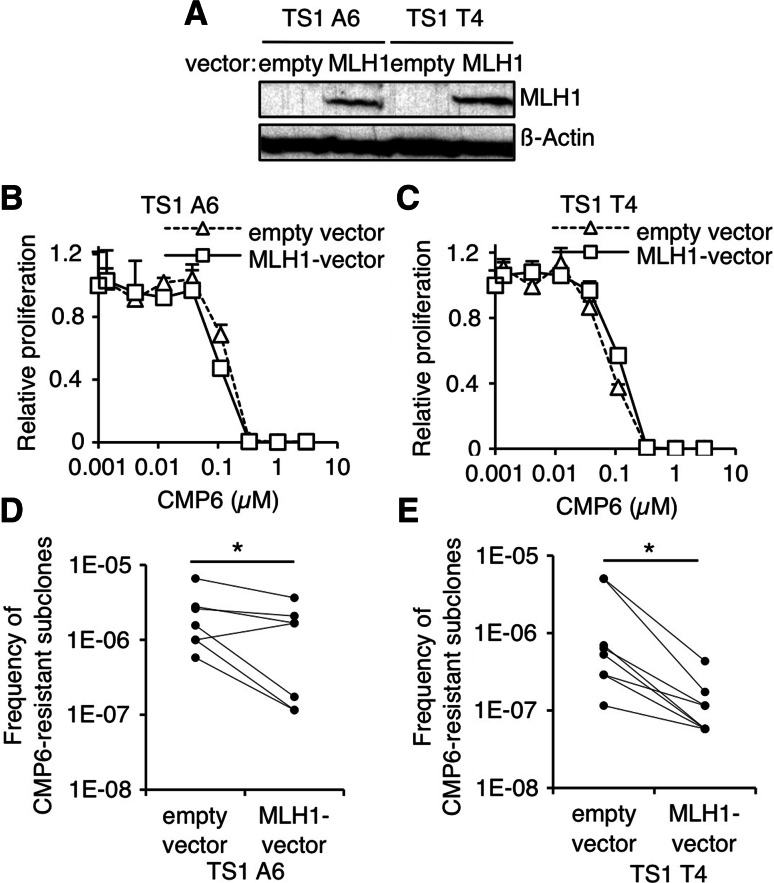
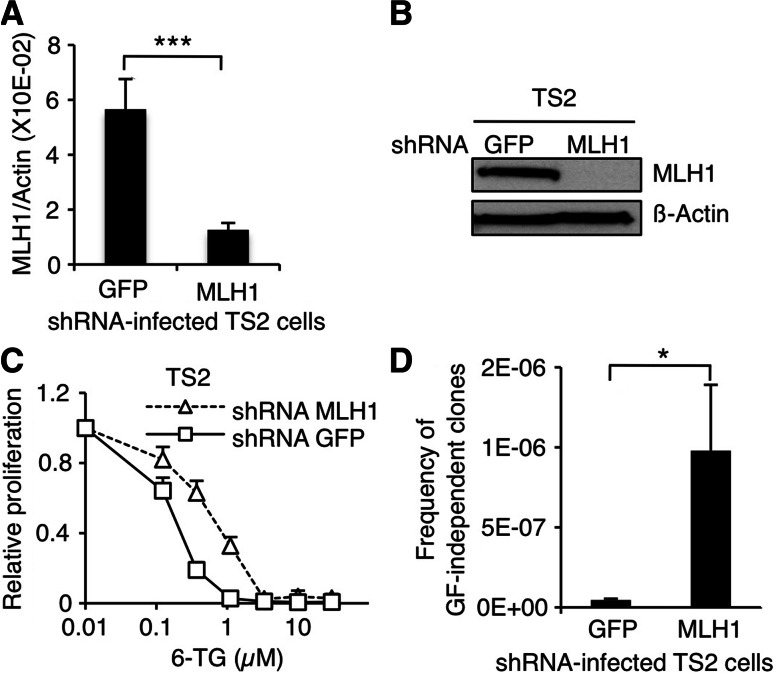
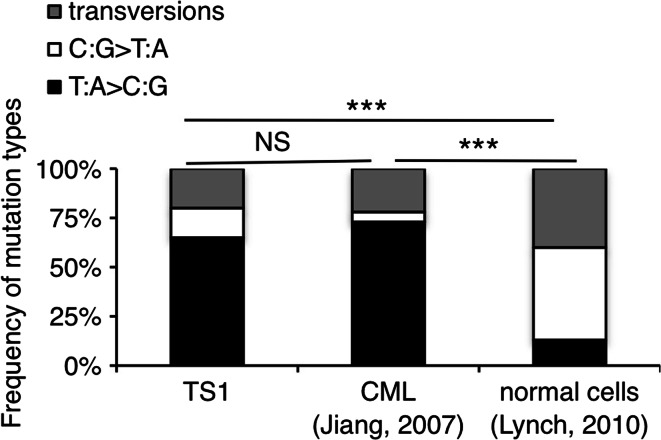
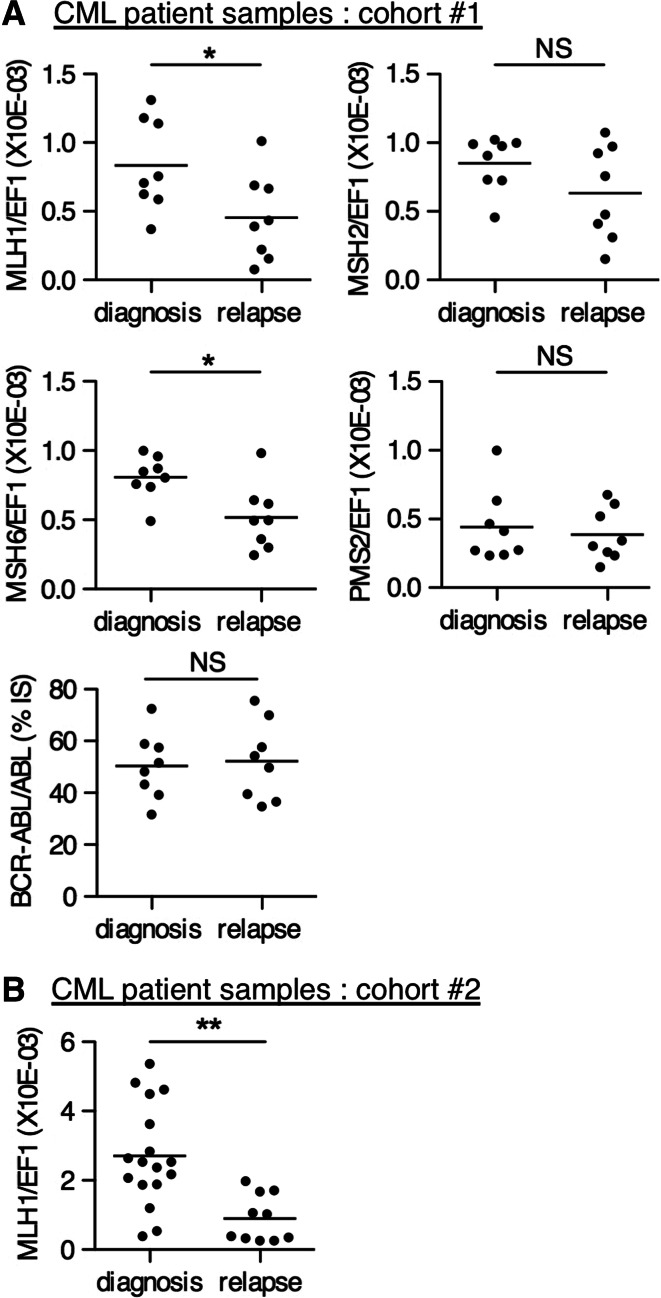
Genomic instability drives cancer progression by promoting genetic abnormalities that allow for the multi-step clonal selection of cells with growth advantages. We previously reported that the IL-9-dependent TS1 cell line sequentially acquired activating substitutions in JAK1 and JAK3 upon successive selections for growth factor independent and JAK inhibitor-resistant cells, suggestive of a defect in mutation avoidance mechanisms. In the first part of this paper, we discovered that the gene encoding mutL homolog-1 (MLH1), a key component of the DNA mismatch repair system, is silenced by promoter methylation in TS1 cells. By means of stable ectopic expression and RNA interference methods, we showed that the high frequencies of growth factor-independent and inhibitor-resistant cells with activating JAK mutations can be attributed to the absence of MLH1 expression. In the second part of this paper, we confirm the clinical relevance of our findings by showing that chronic myeloid leukemia relapses upon ABL-targeted therapy correlated with a lower expression of MLH1 messenger RNA. Interestingly, the mutational profile observed in our TS1 model, characterized by a strong predominance of T:A>C:G transitions, was identical to the one described in the literature for primitive cells derived from chronic myeloid leukemia patients. Taken together, our observations demonstrate for the first time a causal relationship between MLH1-deficiency and incidence of oncogenic point mutations in tyrosine kinases driving cell transformation and acquired resistance to kinase-targeted cancer therapies.

Keywords: DNA mismatch repair; Drug resistance; Janus kinase (JAK); MLH1; Oncogenic mutations; Tyrosine kinase inhibitor.


Conflict of interest statement

The authors declare that they have no conflicts of interest with the contents of this article.

Figures

Fig. 1
Fig. 1
MLH1 expression is lost in TS1 cells. a TS1 and TS2 cells were seeded in 96-well plates at a density of 1000 cells/well in the presence of increasing concentrations of murine IL-9. After 48 h of culture, methyl-H3 thymidine was added to the cells for 4 h and thymidine incorporation was measured. Thymidine incorporation values were standardized relative to the value in the presence of IL-9 100 U/ml. b TS1 and TS2 cells were plated in the absence of IL-9 on 96-well plates at different densities ranging from 200 to 40,000 cells/well. 1–2 weeks later, wells positive for proliferation were visually screened. For TS1 cells, histogram represents mean ± SEM of seven independent selection experiments. Concerning TS2 cells, no GF-independent clones arose from a total of 108 tested cells. c Microarray data are represented as hierarchical clustering of transcripts ×20 differentially expressed in TS1 versus TS2 corresponding to a list of 44 genes (biological duplicates). The image was obtained with the Multiple Experiment Viewer program (MeV). The line corresponding to MLH1 transcript is indicated. d MLH1 mRNA levels were assessed by quantitative RT-PCR in TS1 and TS2 cells. Histograms represent mean ± SD of biological triplicates. Student’s t test was performed to determine p value. e MLH1 protein levels were assessed by western blot in TS1 and TS2 cells. The membrane was probed with anti-β-actin antibody as loading control. f mRNA expression levels of the different components of the MMR system and JAK kinases in TS1 and TS2 cell lines based on the microarray transcriptome analysis. Histograms represent mean ± SD of biological duplicates
Fig. 2
Fig. 2
MLH1 expression is repressed by promoter methylation in TS1 cells. a Methylation status of the MLH1 promoter was determined by bisulfite sequencing of genomic DNA in TS1 and TS2 cells. Circles represent CpG sites (methylated in black, unmethylated in white). Data represent sequencing results of seven clones from the PCR product for each cell line. Numbers indicate the nucleotide position relative to the origin of transcription. b MLH1 mRNA levels were assessed by quantitative RT-PCR in TS1 cells treated with 0/0.5/1/2 µM of 5-AZA-2′deoxycytidine for 48 h. Histograms represent mean ± SEM of three independent experiments. One-way ANOVA test was performed to determine p values (*p < 0.05, ***p < 0.001)
Fig. 3
Fig. 3
Ectopic MLH1 expression in TS1 cells decreases the frequency of GF-independent clones. a MLH1 protein levels were assessed by western blot in TS1 cells electroporated with MLH1 or empty vector. The membrane was probed with anti-β-actin antibody as loading control. b TS1 cells electroporated with MLH1 or empty vector were seeded in 96-well plates at a density of 1000 cells/well in the presence of IL-9 100 U/ml and with increasing concentrations of 6-TG. After 48 h of culture, methyl-H3 thymidine was added to the cells for 4 h and thymidine incorporation was measured. Thymidine incorporation values were standardized relative to the value in the absence of 6-TG. c TS1 cells electroporated with MLH1 or empty vector were seeded in 96-well plates at a density of 1000 cells/well in the presence of increasing concentrations IL-9. After 48 h of culture, methyl-H3 thymidine was added to the cells for 4 h and thymidine incorporation was measured. Thymidine incorporation values were standardized relative to the value in the presence of IL-9 100 U/ml. d TS1 cells were plated in the absence of IL-9 on 96-well plates at different densities ranging from 200 to 20,000 cells/well. 1–2 weeks later, wells positive for proliferation were visually screened. Histograms represent mean ± SEM of six independent selection experiments (3 independent electroporated bulks, each bulk was tested twice). Student’s t test was performed to determine the p value (***p < 0.001)
Fig. 4
Fig. 4
Ectopic MLH1 expression in GF-independent TS1 clones decreases the frequency of CMP6-resistant subclones. a MLH1 protein levels were assessed by western blot in TS1 A6 and T4 GF-independent clones electroporated with MLH1 or empty vector. The membrane was probed with anti-β-actin antibody as loading control. b, c GF-independent TS1 A6 and T4 clones electroporated with MLH1 or empty vector were seeded in 96-well plates at a density of 1000 cells/wells in the presence of increasing concentrations of CMP6. After 48 h of culture, methyl-H3 thymidine was added to the cells for 4 h and thymidine incorporation was measured. Thymidine incorporation values were standardized relative to the value in the absence of CMP6. d, e GF-independent TS1 A6 and T4 clones electroporated with MLH1 or empty vector were plated in the presence of CMP6 (300–600 nM) on 96-well plates at a density of 30,000 cells/well. 2–3 weeks later, wells positive for proliferation were visually screened. Graphs represent paired frequency values from seven and eight independent selection experiments (each of the four electroporated set was at least tested once). Paired Wilcoxon test was performed to determine p values (*p < 0.05)
Fig. 5
Fig. 5
shRNA-mediated MLH1 knock-down in TS2 cells increases the frequency of GF-independent clones. a MLH1 mRNA levels assessed by quantitative RT-PCR in TS2 cells infected with retroviruses coding for shRNA against MLH1 or GFP. Histograms represent mean ± SEM of seven independent infection experiments. Student’s t test was performed to determine p value. b MLH1 protein levels assessed by western blot in shRNA-infected TS2. The membrane was probed with anti-β-actin antibody as loading control. c TS2 cells infected with retroviruses coding for shRNA against MLH1 or GFP were seeded in 96-well plates at a density of 1000 cells/well in the presence of IL-9 100 U/ml and with increasing concentrations of 6-TG. After 48 h of culture, methyl-H3 thymidine was added to the cells for 4 h and thymidine incorporation was measured. Thymidine incorporation values were standardized relative to the value in the absence of 6-TG. d TS2 cells infected with retroviruses coding for shRNA against MLH1 or GFP were plated in the absence of IL-9 on 96-well plates at a density of 40,000 cells/well. 1–2 weeks later, wells positive for proliferation were visually screened. Histograms represent mean ± SEM of seven independent selection experiments (each set of infected cells was tested once). Student’s t test was performed to determine p values (*p < 0.05, ***p < 0.001)
Fig. 6
Fig. 6
TS1 and CML cells share a common mutational profile distinct from normal cells. The diagrams present the percentages of T:A>C:G and C:G>T:A transitions as well as transversions (substitutions of a purine by a pyrimidine base and conversely) occurring in JAK1 and JAK3 genes for the TS1 cells, in BCR-ABL for CML cells [32, 33] and in unselected regions of the genome for the normal cells [29]. χ 2 test was performed to determine the p values (***p < 0.001; NS non-significant)
Fig. 7
Fig. 7
MLH1 mRNA expression is down-regulated in imatinib-resistant versus newly diagnosed CML patient samples. MLH1 mRNA levels assessed by quantitative RT-PCR in CML blood samples taken at diagnosis or at relapse after imatinib treatment from two independent sets of patients, a samples of our test cohort (cohort #1) from Saint-Luc Hospital, Brussels (n = 8 for both diagnosis and relapse) and b samples of the validation cohort (cohort #2) from the University of Bordeaux (n = 17 for diagnosis, n = 10 for relapse). MSH2, MSH6, PMS2 levels, as well as BCR-ABL/ABL ratios of our test cohort from Saint-Luc Hospital are also shown. Horizontal lines represent the mean values. Non-parametric Mann–Whitney one-tailed test was performed to calculate the p values (*p < 0.05, **p < 0.01, NS non-significant

Similar articles

Cited by

References

    1. Stratton MR, Campbell PJ, Futreal PA. The cancer genome. Nature. 2009;458(7239):719–724. doi: 10.1038/nature07943. - DOI - PMC - PubMed
    1. Loeb LA. A mutator phenotype in cancer. Cancer Res. 2001;61(8):3230–3239. - PubMed
    1. Fox EJ, Prindle MJ, Loeb LA. Do mutator mutations fuel tumorigenesis? Cancer Metastasis Rev. 2013;32(3–4):353–361. doi: 10.1007/s10555-013-9426-8. - DOI - PMC - PubMed
    1. Roche-Lestienne C, Soenen-Cornu V, Grardel-Duflos N, et al. Several types of mutations of the Abl gene can be found in chronic myeloid leukemia patients resistant to STI571, and they can pre-exist to the onset of treatment. Blood. 2002;100(3):1014–1018. doi: 10.1182/blood.V100.3.1014. - DOI - PubMed
    1. Bodmer W, Bielas JH, Beckman RA. Genetic instability is not a requirement for tumor development. Cancer Res. 2008;68(10):3558–3560. doi: 10.1158/0008-5472.CAN-07-6544. - DOI - PMC - PubMed

Publication types

MeSH terms

Substances

LinkOut - more resources