Depressive symptoms as a side effect of Interferon-α therapy induced by induction of indoleamine 2,3-dioxygenase 1
- PMID: 27436416
- PMCID: PMC4951771
- DOI: 10.1038/srep29920
Depressive symptoms as a side effect of Interferon-α therapy induced by induction of indoleamine 2,3-dioxygenase 1
Abstract
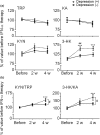
Depression is known to occur frequently in chronic hepatitis C viral (HCV) patients receiving interferon (IFN)-α therapy. In this study, we investigated whether indoleamine 2,3-dioxygenase1 (IDO1)-mediated tryptophan (TRP) metabolism plays a critical role in depression occurring as a side effect of IFN-α therapy. Increases in serum kynurenine (KYN) and 3-hydroxykynurenine (3-HK) concentrations and in the ratios of KYN/TRP and 3-HK/kynurenic acid (KA) were much larger in depressive HCV patients than in non-depressed patients following therapy. Furthermore, transfection of a plasmid continuously expressing murine IFN-γ into normal mice significantly increased depression-like behavior. IFN-γ gene transfer also resulted in a decrease in serum TRP levels in the mice while KYN and 3-HK levels were significantly increased in both serum and frontal cortex. Genetic deletion of IDO1 in mice abrogated both the increase in depression-like behavior and the elevation in TRP metabolites' levels, and the turnover of serotonin in the frontal cortex after IFN-γ gene transfer. These results indicate that the KYN pathway of IDO1-mediated TRP metabolism plays a critical role in depressive symptoms associated with IFN-α therapy.
Figures


Similar articles
-
IDO and interferon-alpha-induced depressive symptoms: a shift in hypothesis from tryptophan depletion to neurotoxicity.Mol Psychiatry. 2005 Jun;10(6):538-44. doi: 10.1038/sj.mp.4001600. Mol Psychiatry. 2005. PMID: 15494706 Clinical Trial.
-
Effects of PEG-interferon alpha plus ribavirin on tryptophan metabolism in patients with chronic hepatitis C.Pharmacol Res. 2011 Jan;63(1):85-92. doi: 10.1016/j.phrs.2010.10.009. Epub 2010 Oct 19. Pharmacol Res. 2011. PMID: 20940053
-
[Impact of interferon alpha immunotherapy on tryptophan metabolism in patients with chronic hepatitis C. Results of a pilot studies on ten patients].Encephale. 2009 Oct;35(5):477-83. doi: 10.1016/j.encep.2007.09.007. Epub 2008 Jun 12. Encephale. 2009. PMID: 19853722 French.
-
Implications of interferon-induced tryptophan catabolism in cancer, auto-immune diseases and AIDS.Adv Exp Med Biol. 1991;294:425-35. doi: 10.1007/978-1-4684-5952-4_39. Adv Exp Med Biol. 1991. PMID: 1722946 Review.
-
The new '5-HT' hypothesis of depression: cell-mediated immune activation induces indoleamine 2,3-dioxygenase, which leads to lower plasma tryptophan and an increased synthesis of detrimental tryptophan catabolites (TRYCATs), both of which contribute to the onset of depression.Prog Neuropsychopharmacol Biol Psychiatry. 2011 Apr 29;35(3):702-21. doi: 10.1016/j.pnpbp.2010.12.017. Epub 2010 Dec 23. Prog Neuropsychopharmacol Biol Psychiatry. 2011. PMID: 21185346 Review.
Cited by
-
Potential antidepressant effects of Traditional Chinese botanical drug formula Chaihu-Shugan-San and its active ingredients.Front Pharmacol. 2024 Apr 2;15:1337876. doi: 10.3389/fphar.2024.1337876. eCollection 2024. Front Pharmacol. 2024. PMID: 38628641 Free PMC article. Review.
-
Alpha Synuclein Toxicity and Non-Motor Parkinson's.Cells. 2024 Jul 27;13(15):1265. doi: 10.3390/cells13151265. Cells. 2024. PMID: 39120295 Free PMC article. Review.
-
Lipopolysaccharide shock reveals the immune function of indoleamine 2,3-dioxygenase 2 through the regulation of IL-6/stat3 signalling.Sci Rep. 2018 Oct 29;8(1):15917. doi: 10.1038/s41598-018-34166-4. Sci Rep. 2018. PMID: 30374077 Free PMC article.
-
Indoleamine 2,3-Dioxygenase-Dependent Neurotoxic Kynurenine Metabolism Contributes to Poststroke Depression Induced in Mice by Ischemic Stroke along with Spatial Restraint Stress.Oxid Med Cell Longev. 2018 Dec 30;2018:2413841. doi: 10.1155/2018/2413841. eCollection 2018. Oxid Med Cell Longev. 2018. PMID: 30693061 Free PMC article.
-
Detection of the role of intestinal flora and tryptophan metabolism involved in antidepressant-like actions of crocetin based on a multi-omics approach.Psychopharmacology (Berl). 2022 Nov;239(11):3657-3677. doi: 10.1007/s00213-022-06239-w. Epub 2022 Sep 28. Psychopharmacology (Berl). 2022. PMID: 36169685
References
-
- Szabo E., Lotz G., Paska C., Kiss A. & Schaff Z. Viral hepatitis: new data on hepatitis C infection. Pathology oncology research: POR 9, 215–221, PAOR.2003.9.4.0215 (2003). - PubMed
Publication types
MeSH terms
Substances
LinkOut - more resources
Full Text Sources
Other Literature Sources
Medical
Research Materials

