. 2016 Jul 20:7:12240.
doi: 10.1038/ncomms12240.

Glycolytic regulation of cell rearrangement in angiogenesis

Affiliations

Glycolytic regulation of cell rearrangement in angiogenesis

Bert Cruys et al. Nat Commun. .

Abstract

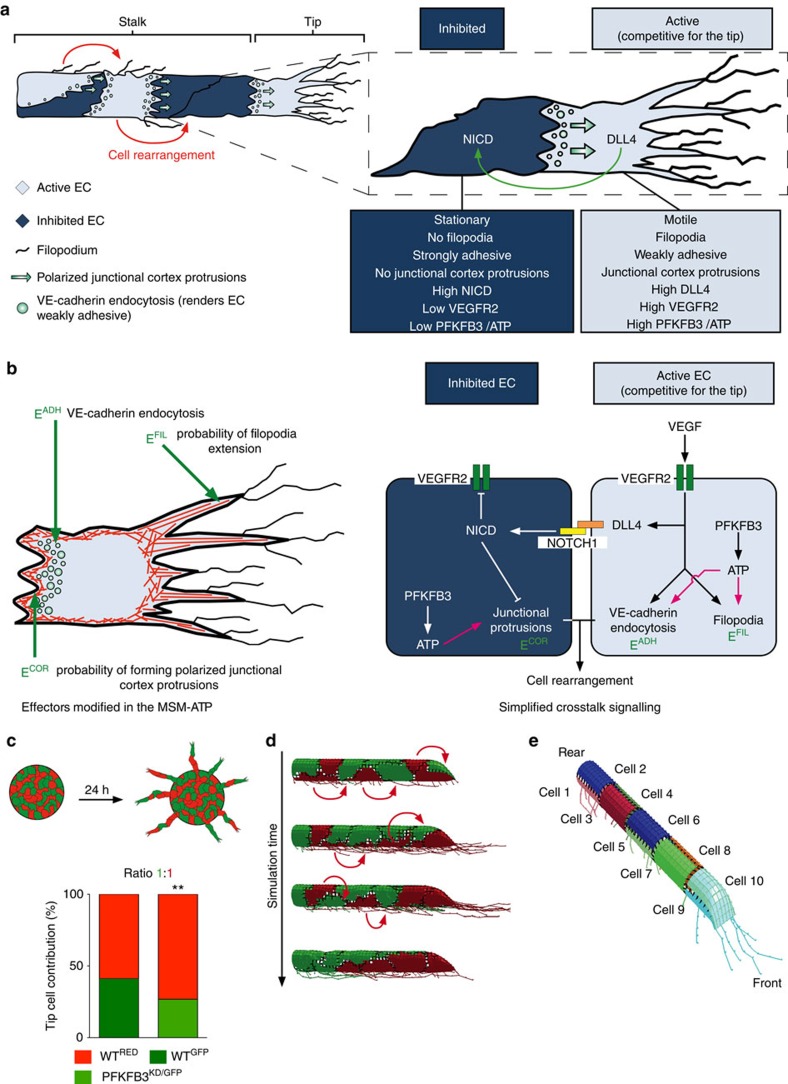
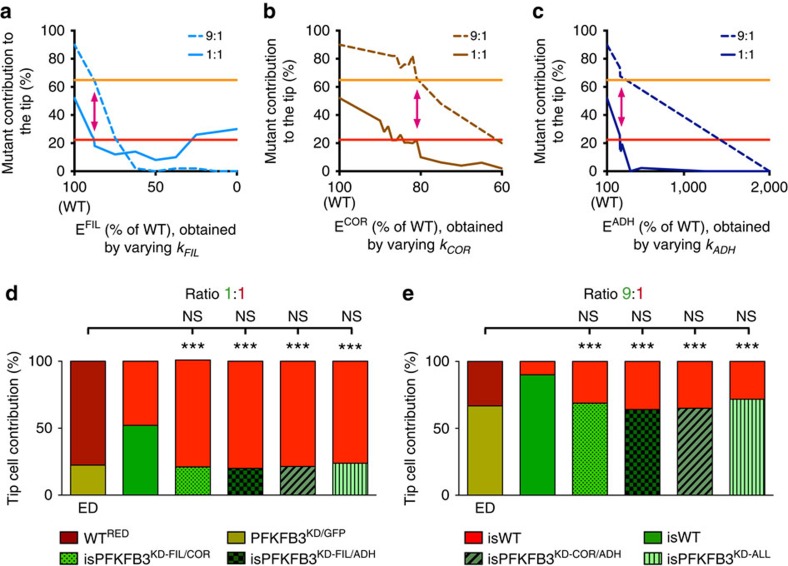
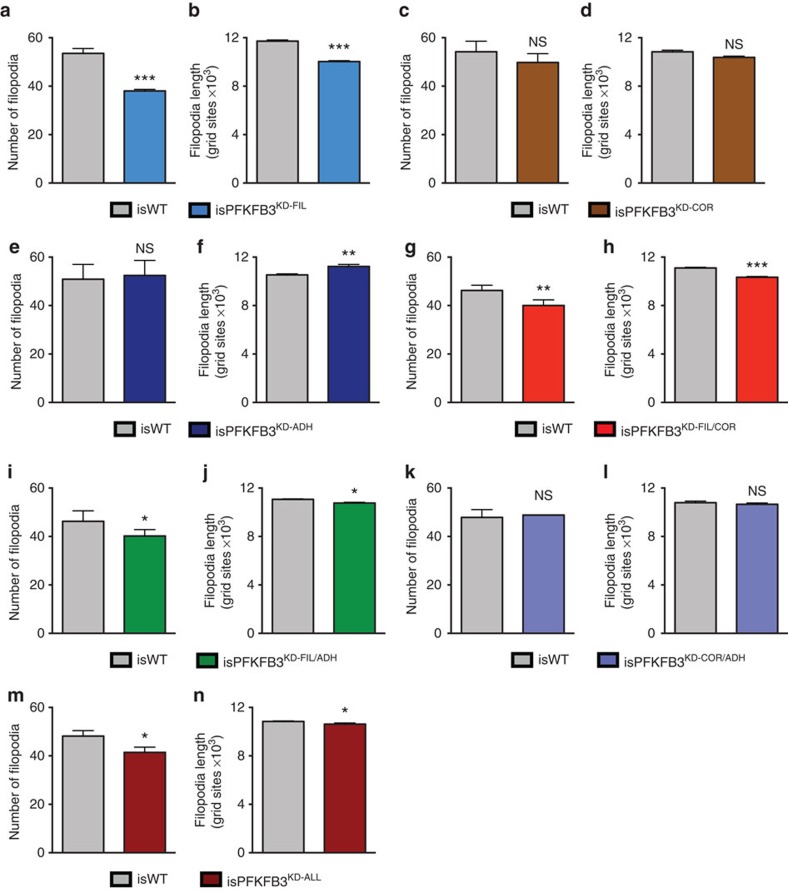
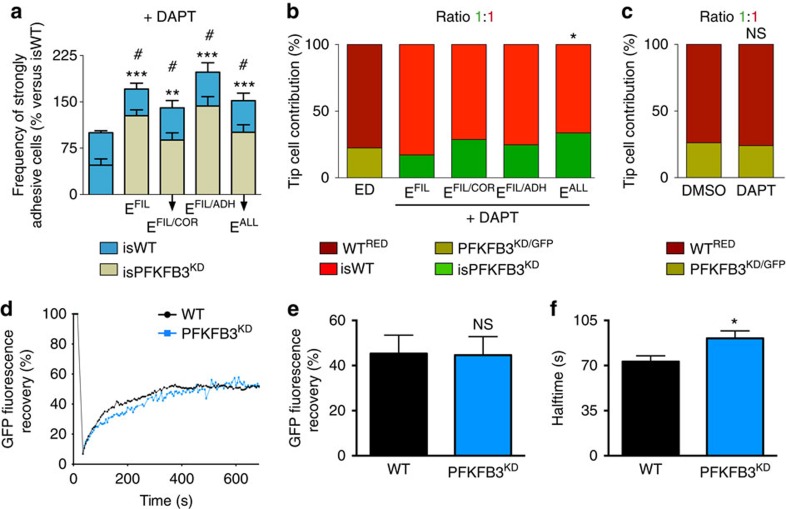
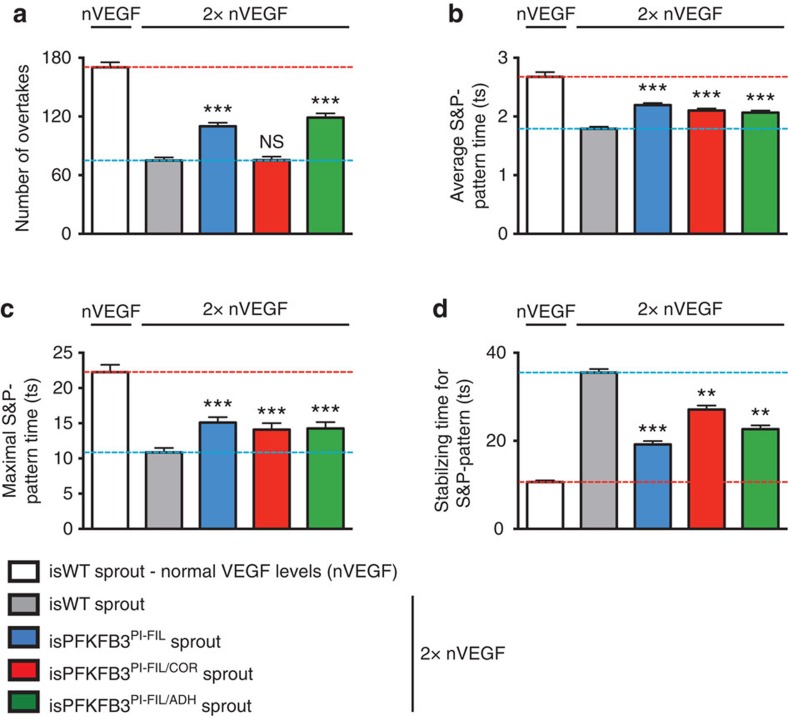
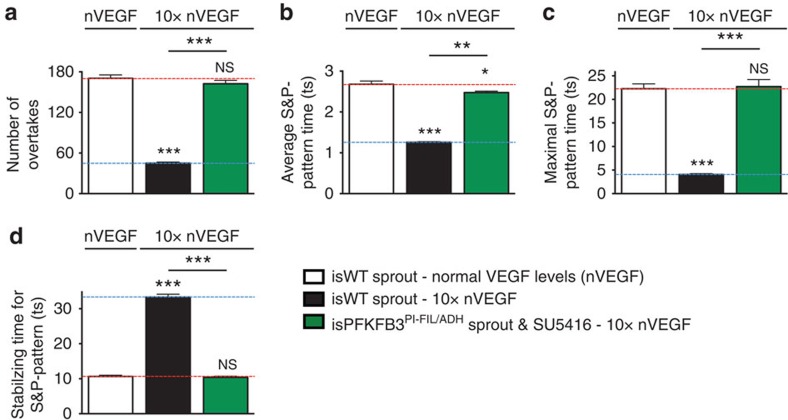
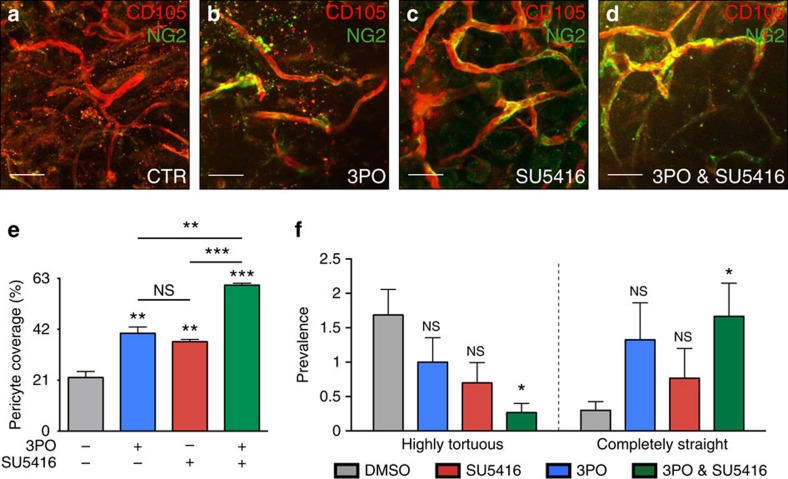
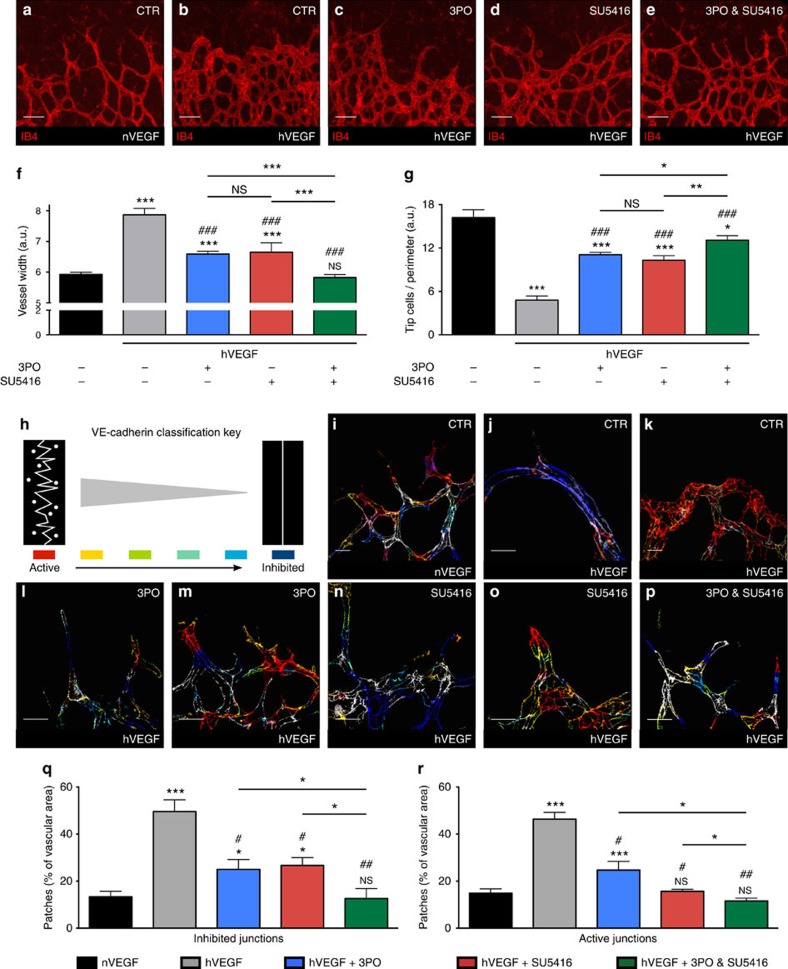
During vessel sprouting, endothelial cells (ECs) dynamically rearrange positions in the sprout to compete for the tip position. We recently identified a key role for the glycolytic activator PFKFB3 in vessel sprouting by regulating cytoskeleton remodelling, migration and tip cell competitiveness. It is, however, unknown how glycolysis regulates EC rearrangement during vessel sprouting. Here we report that computational simulations, validated by experimentation, predict that glycolytic production of ATP drives EC rearrangement by promoting filopodia formation and reducing intercellular adhesion. Notably, the simulations correctly predicted that blocking PFKFB3 normalizes the disturbed EC rearrangement in high VEGF conditions, as occurs during pathological angiogenesis. This interdisciplinary study integrates EC metabolism in vessel sprouting, yielding mechanistic insight in the control of vessel sprouting by glycolysis, and suggesting anti-glycolytic therapy for vessel normalization in cancer and non-malignant diseases.


Conflict of interest statement

P.C. declares being named as inventor on patent applications claiming subject matter related to the results described in this paper. The remaining authors declare no competing financial interests.

Figures

Figure 1
Figure 1. General concept of the study.
(a) Schematic of a sprout showing the differential properties of its ECs, which are activated or inhibited. Active ECs inhibit adjacent cells through Dll4/Notch signalling, are migratory and competitive for the tip. They overtake other ECs (cell rearrangement) due to higher VE-cadherin endocytosis rates (which makes them weakly adhesive) and formation of junctional cortical protrusions. (b) Scheme depicting the effectors modified in the memAgent-Spring ATP model (MSM-ATP) and the signalling pathways included in the MSM-ATP. EFIL (representing filopodial F-actin), ECOR (referring to cortical actin), and EADH (denoting intercellular adhesion) determine respectively, the probability of filopodia extension, the formation of polarized junctional protrusions and cellular adhesion levels, determined by VE-cadherin endocytosis. The pink lines indicate the ATP effector links that were investigated. (c) Schematic drawing of the in vitro EC spheroid assay. Cells with different genotypes (and corresponding colours) are cultured in a sphere and allowed to sprout for 24 hours upon growth factor stimulation. Subsequently, the colour of the cell at the tip is counted for each sprout, allowing to quantify the tip cell contribution as shown in the graph for 1:1 WTGFP:WTRED and PFKFB3KD/GFP:WTRED mosaic spheroids. Data are mean±s.e.m.; n=30 from 3 donors; **P<0.01; Fisher's exact test; adapted from ref. with permission from Elsevier. (d) Screenshots of MSM-ATP simulations, showing how cell positions change over time and how, similar as in the in vitro assay, the genotype (colour) of the cell at the end of the in silico experiments can be assessed. The red arrows represent the movement of the cell to its next position in the next simulation screenshot. (e) Scheme illustrating how MSM-ATP simulations are performed using vessel sprouts consisting of ten ECs. Each colour represents a different EC. ATP, adenosine triphosphate; DLL4, delta-like 4; NICD, Notch1 intracellular domain; PFKFB3, 6-phosphofructo-2-kinase/fructose-2,6-bisphosphatase 3; VE-cadherin, vascular endothelial cadherin; VEGF, vascular endothelial growth factor; VEGFR2, VEGF receptor 2.
Figure 2
Figure 2. Effector mechanism simulations of tip cell contribution.
(a–c) Sensitivity analyses of respectively EFIL (a), ECOR (b) and EADH (c) as single mechanism governing tip cell competition, by varying over a wide range values of respectively kFIL, kCOR and kADH. The results for both the 1:1 (full line) and 9:1 (dashed line) in silico PFKFB3KD:WT (isPFKFB3KD:isWT) mosaic sprouts are shown. The red and orange horizontal line depict the tip cell contribution of PFKFB3KD cells, as obtained experimentally in respectively the 1:1 and 9:1 PFKFB3KD:WT sprouts. The combined 1:1 and 9:1 simulation results yielded one specific k value (see pink double-headed arrow) for every single effector mechanism. (d,e) Combinatorial EFIL/COR, EFIL/ADH, ECOR/ADH and EALL simulations of tip cell contribution in 1:1 (d) or 9:1 (e) isPFKFB3KD:isWT mosaic sprouts, illustrating that for every combinatorial effector, k values for its contributing effectors could be obtained matching the competitive disadvantage for PFKFB3KD cells as observed in the experimental PFKFB3KD:WT EC spheroid competition data (experimental data (ED), n=30 spheroids from 3 donors). For each combinatorial effector, the same k values matched both the 1:1 (first bar in d) and 9:1 (first bar in e) experimental mosaic PFKFB3KD:WT sprout data. The second bar in panel d and e shows the expected 50% (d) or 90% (e) contribution of isWT cells in 1:1 (d) or 9:1 (e) isWT:isWT sprouts. n=150; ***P<0.001, versus isWT:isWT. ‘NS' (not significant) versus ED; Fisher's exact test.
Figure 3
Figure 3. EFIL-containing isPFKFB3KD mechanisms have reduced filopodia.
(a-n) Number and length of filopodia for in silico WT (isWT) and in silico PFKFB3KD (isPFKFB3KD) cells, modelled by modifying the single mechanisms EFIL (a,b), ECOR (c,d) and EADH (e,f), and the combinatorial mechanisms EFIL/COR (g,h), EFIL/ADH (i,j), ECOR/ADH (k,l) and EALL (m,n). Data are mean±s.e.m.; n=4–5; NS, not significant, *P<0.05, **P<0.01, ***P<0.001; Student's t-test.
Figure 4
Figure 4. PFKFB3KD increases intercellular heterogeneity.
(a) Analysis of EC adhesive strength of isWT cells in isWT:isWT sprouts (first bar) and isPFKFB3KD-FIL, isPFKFB3KD-FIL/COR, isPFKFB3KD-FIL/ADH and isPFKFB3KD-ALL cells in a 1:1 isPFKFB3KD:isWT mosaic sprout treated with DAPT. Modifying EFIL, EFIL/COR, EFIL/ADH and EALL increased the fraction of isPFKFB3KD cells that were classified as strongly adhesive, less motile cells (resulting in more heterogeneity in adhesion between sprout cells). Data are mean±s.e.m.; n=10; **P<0.01 and ***P<0.001 versus isWT for total number of strongly adhesive cells; #P<0.001: frequency of strongly adhesive isPFKFB3KD mutants versus the expected frequency (50%); Student's t-test. (b) EFIL, EFIL/COR, EFIL/ADH, and EALL simulations of tip cell contribution in a 1:1 isPFKFB3KD:isWT mosaic sprout treated with DAPT. The first bar shows the in vitro experimental data (ED, n=30 spheroids from 3 donors) obtained when using PFKFB3KD:WT sprouts. Only isPFKFB3KD-ALL cells showed different tip cell behaviour upon DAPT treatment. n=150; *P<0.05 versus ED; Fisher's exact test. (c) In vitro EC spheroid assay using 1:1 mosaic PFKFB3KD/GFP:WTRED sprouts treated with DAPT or control vehicle (DMSO), showing that DAPT treatment did not change the impaired tip cell contribution of PFKFB3KD/GFP cells. n=70 spheroids from 3 donors; NS: not significant; Fisher's exact test. (d-f) FRAP experiment using confluent cultures of WT and PFKFB3KD ECs expressing a VE-cadherin-GFP fusion protein. Representative fluorescence recovery curves after photobleaching (d). Quantification of VE-cadherin mobility (e) and turnover (f) for control and PFKFB3KD ECs (n=27 (WT) and n=28 (PFKFB3KD) from 3 donors). Data are mean±s.e.m.; NS, not significant, *P<0.05; Student's t-test.
Figure 5
Figure 5. Modifying EFIL and EFIL/ADH partially normalizes EC dynamics.
(a–d) Number of overtakes (a), the average (b) and maximal time (c) during which a salt and pepper (S&P) pattern is maintained, and the time required to acquire a stable S&P pattern (d) for in silico WT (isWT) ECs in non-mosaic sprouts, in which PFKFB3 was pharmacologically blocked (isPFKFB3PI) simulated by modifying EFIL (blue), EFIL/COR (red) and EFIL/ADH (green) in VEGF levels 2-fold higher than normal (2 × nVEGF). The white and grey bars represent a simulated isWT sprout in normal VEGF (nVEGF) and 2 × nVEGF levels, respectively. The horizontal red and blue dotted lines show the particular values of an isWT sprout in normal and 2 × VEGF levels, respectively. ts: timestep. Data are mean±s.e.m.; n=50; NS, not significant, **P<0.01, ***P<0.001 versus isWT in 2 × nVEGF; Student's t-test.
Figure 6
Figure 6. Anti-VEGF is predicted to synergize with anti-metabolic therapy.
(a–d) Number of overtakes (a), the average (b) and maximal time (c) during which a salt and pepper (S&P) pattern is maintained, and the time required to acquire a stable S&P pattern (d) for in silico WT (isWT) ECs in non-mosaic sprouts, in which PFKFB3 was pharmacologically blocked (isPFKFB3PI) simulated by modifying EFIL/ADH and blocking VEGF signalling (green; ‘isPFKFB3PI-FIL/ADH sprout and SU5416') in VEGF levels 10-fold higher than normal (10 × nVEGF). The white and black bars represent a simulated isWT sprout in normal VEGF (nVEGF) and 10 × nVEGF levels, respectively. The horizontal red and blue dotted lines show the particular values of an isWT sprout in normal and 10x VEGF levels, respectively. ts, timestep. Data are mean±s.e.m.; n=50; NS, not significant, ***P<0.001 versus isWT in nVEGF; the statistical significance between the black and green bars is also indicated (**P<0.01, ***P<0.001); Student's t-test.
Figure 7
Figure 7. 3PO plus SU5416 combo-therapy normalizes pathological vessels.
(a–d) Representative images of VEGF-containing Matrigel plugs treated with control vehicle (a), the PFKFB3 blocker 3PO (b), the VEGFR2 inhibitor SU5416 (c), and a combination treatment of 3PO plus SU5416 (d), and immunostained for the EC marker CD105 (red) and the pericyte marker NG2 (green). Scale bar, 40 μm. (e) Quantification of the NG2-coverage of vessels in the Matrigel model, treated with control vehicle (DMSO, grey), 3PO (blue), SU5416 (red), or 3PO plus SU5416 (green). Data are mean±s.e.m.; n=3–5 Matrigel plugs per condition; NS: not significant, **P<0.01, ***P<0.001; Student's t-test. (f) Blood vessel tortuosity in the Matrigel model, treated with control vehicle (DMSO, grey), 3PO (blue), SU5416 (red), or 3PO plus SU5416 (green), was analysed semi-quantitatively by an observer blinded for the conditions. Data are mean±s.e.m.; n=3–5 Matrigel plugs per condition; NS, not significant; *P<0.05; Two-tailed Wilcoxon rank-sum test for equal medians.
Figure 8
Figure 8. 3PO / SU5416 combo-therapy normalizes pathological angiogenesis.
(a–e) Representative images of retinas (× 20 magnification) stained for isolectinB4 (IB4) in normal conditions (nVEGF, a) and after VEGF injection (hVEGF, b-e). Pups were treated with DMSO (CTR, a,b), 3PO (c), SU5416 (d) or 3PO plus SU5416 (e). Note the widened vessel lumen and fewer tip cells at the vascular forefront upon VEGF injection (b), and the partial (c,d) and complete (e) normalization by single or combined 3PO and SU5416 treatment. Scale bar, 50 μm. (f,g) Quantification of vessel width (f) and tip cell number at the retinal front (g). Data are mean±s.e.m.; n=7 per condition; NS: not significant, *P<0.05, ***P<0.001 versus DMSO-treated vessels in normal conditions. ###, P<0.001 versus DMSO-treated vessels in hVEGF. The statistical significance between the single or combined 3PO/SU5416 treatments is also indicated (NS: not significant, *P<0.05, **P<0.01, ***P<0.001); Student's t-test. a.u., arbitrary units. (h) VE-cadherin junction classification from ‘active' (red; irregular/serrated morphology with vesicular/diffuse regions) to ‘inhibited' (dark blue; straighter morphology and less vesicular staining). (i–p) VE-cadherin morphology of retinal vessels was hand-classified according to the key in h, yielding VE-cadherin heat maps in normal conditions (nVEGF, i) and upon VEGF injection (hVEGF, jp) of pups, treated with DMSO (j,k), 3PO (l,m), SU5416 (n,o), or 3PO plus SU5416 (p). The colour(s) provide insight into the extent of junctional heterogeneity of the vessels. Compared to the heterogeneous VE-cadherin pattern in nVEGF retinas (i), hVEGF induces clusters of inhibited (j) or activated (k) ECs. These clusters are smaller upon 3PO (inhibited: l; active: m) or SU5416 monotherapy (inhibited: n; active: o) and completely normalized to heterogeneous patterns upon combined 3PO plus SU5416 treatment (p). Scale bar, 20 μm. (q,r) Prevalence of strongly inhibited (q) or activated (r) VE-cadherin junctions in retinal vessels. Data are mean±s.e.m.; n=5–9 per condition; NS, not significant, *P<0.05, ***P<0.001 versus nVEGF (black); #P<0.05, ##P<0.01 versus hVEGF (grey). The statistical significance between the single or combined 3PO/SU5416 treatments is also indicated (*P<0.05); One-tailed Wilcoxon rank-sum test for equal medians.

References

    1. Phng L. K. & Gerhardt H. Angiogenesis: a team effort coordinated by notch. Dev. Cell 16, 196–208 (2009). - PubMed
    1. Potente M., Gerhardt H. & Carmeliet P. Basic and therapeutic aspects of angiogenesis. Cell 146, 873–887 (2011). - PubMed
    1. Arima S. et al.. Angiogenic morphogenesis driven by dynamic and heterogeneous collective endothelial cell movement. Development 138, 4763–4776 (2011). - PubMed
    1. Jakobsson L. et al.. Endothelial cells dynamically compete for the tip cell position during angiogenic sprouting. Nat. Cell Biol. 12, 943–953 (2010). - PubMed
    1. De Bock K. et al.. Role of PFKFB3-driven glycolysis in vessel sprouting. Cell 154, 651–663 (2013). - PubMed

Publication types

MeSH terms