

Mitigation of eddy current heating during magnetic nanoparticle hyperthermia therapy
- PMID: 27436449
- PMCID: PMC5095930
- DOI: 10.1080/02656736.2016.1195018
Mitigation of eddy current heating during magnetic nanoparticle hyperthermia therapy
Abstract
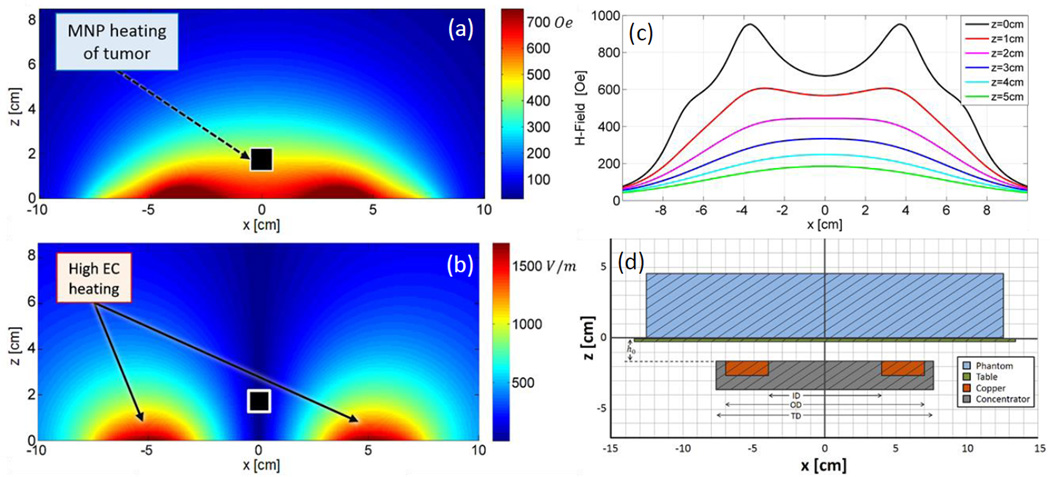
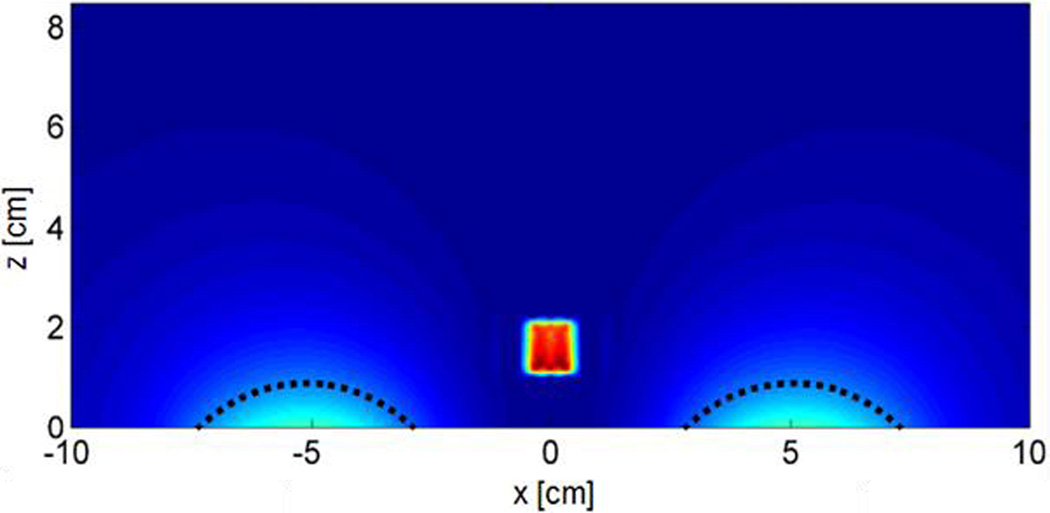
Background: Magnetic nanoparticle hyperthermia therapy is a promising technology for cancer treatment, involving delivering magnetic nanoparticles (MNPs) into tumours then activating them using an alternating magnetic field (AMF). The system produces not only a magnetic field, but also an electric field which penetrates normal tissue and induces eddy currents, resulting in unwanted heating of normal tissues. Magnitude of the eddy current depends, in part, on the AMF source and the size of the tissue exposed to the field. The majority of in vivo MNP hyperthermia therapy studies have been performed in small animals, which, due to the spatial distribution of the AMF relative to the size of the animals, do not reveal the potential toxicity of eddy current heating in larger tissues. This has posed a non-trivial challenge for researchers attempting to scale up to clinically relevant volumes of tissue. There is a relative dearth of studies focused on decreasing the maximum temperature resulting from eddy current heating to increase therapeutic ratio.
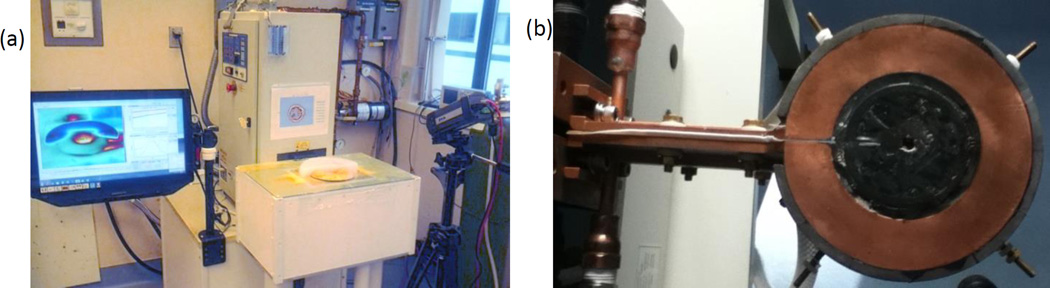
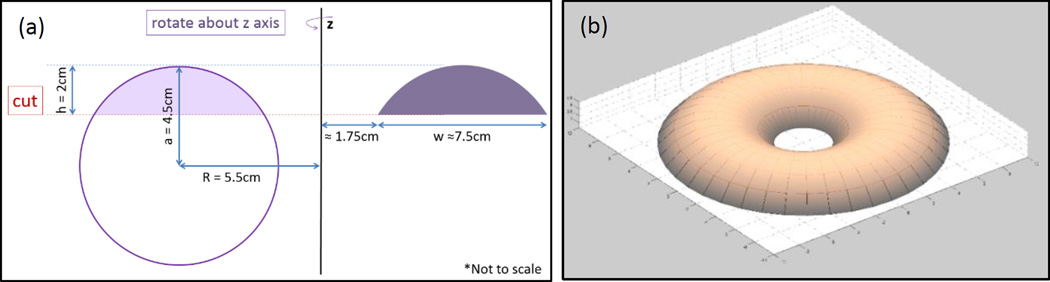
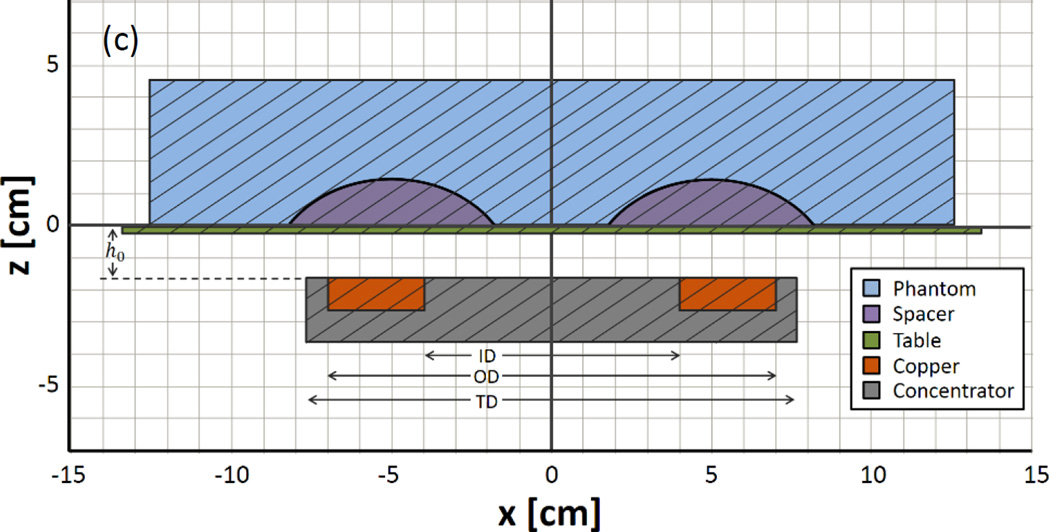
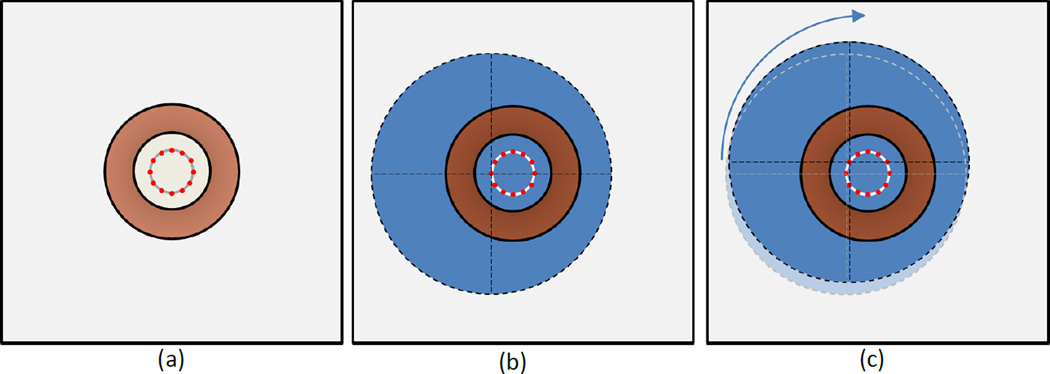
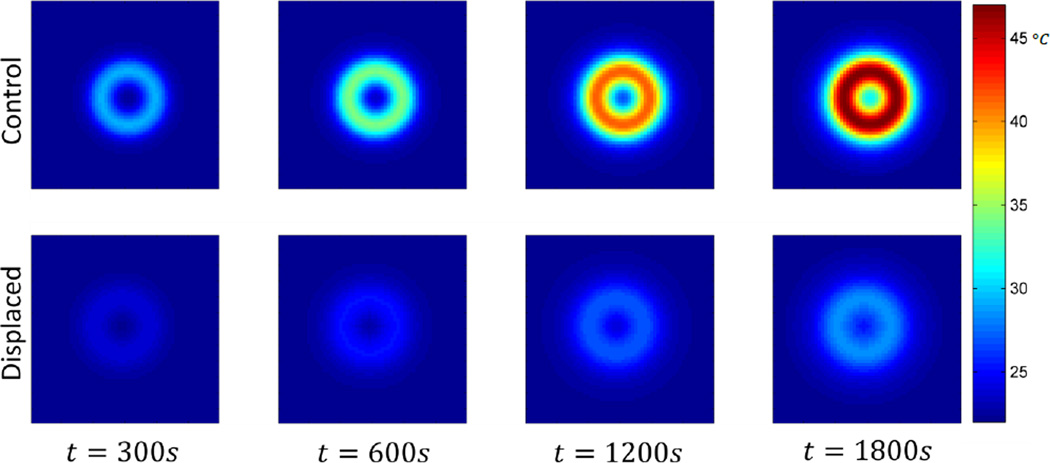
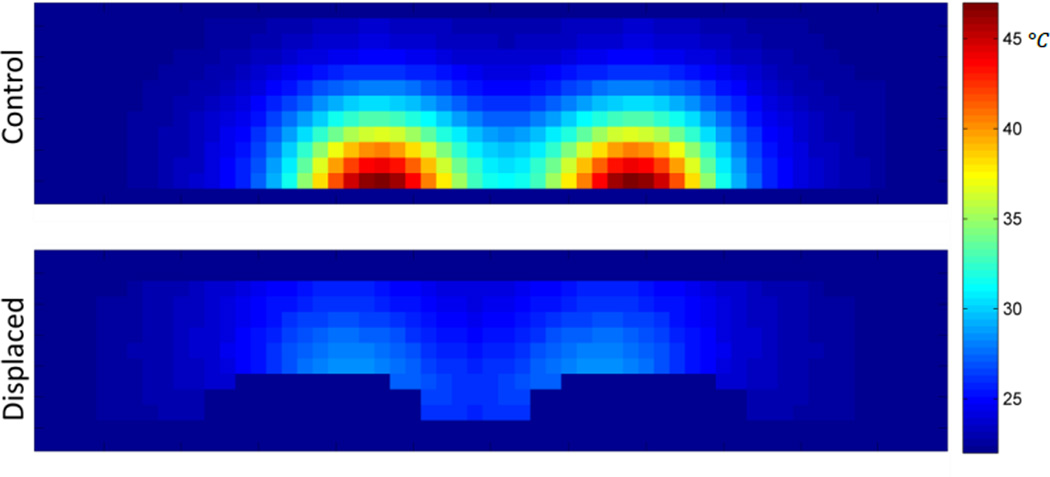
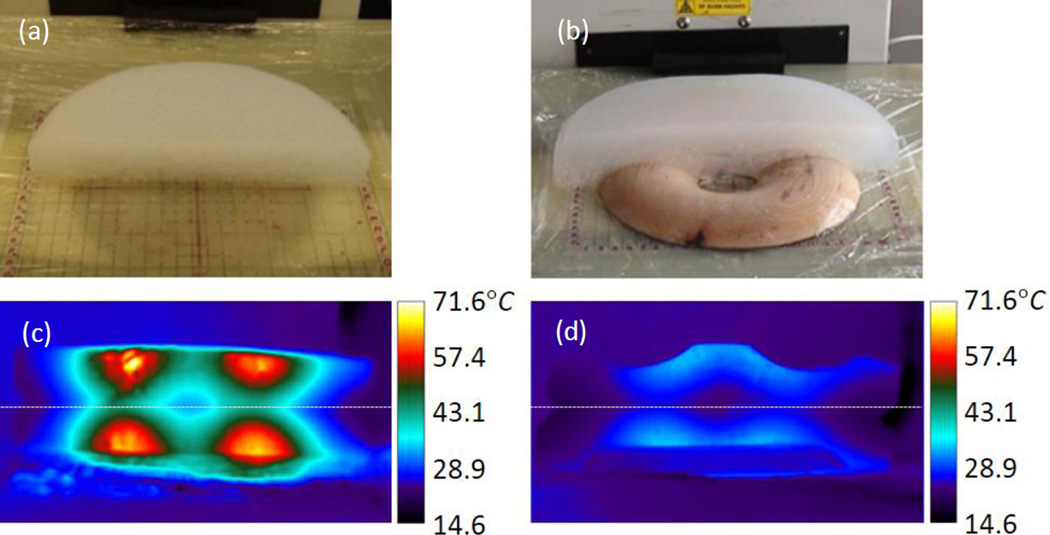
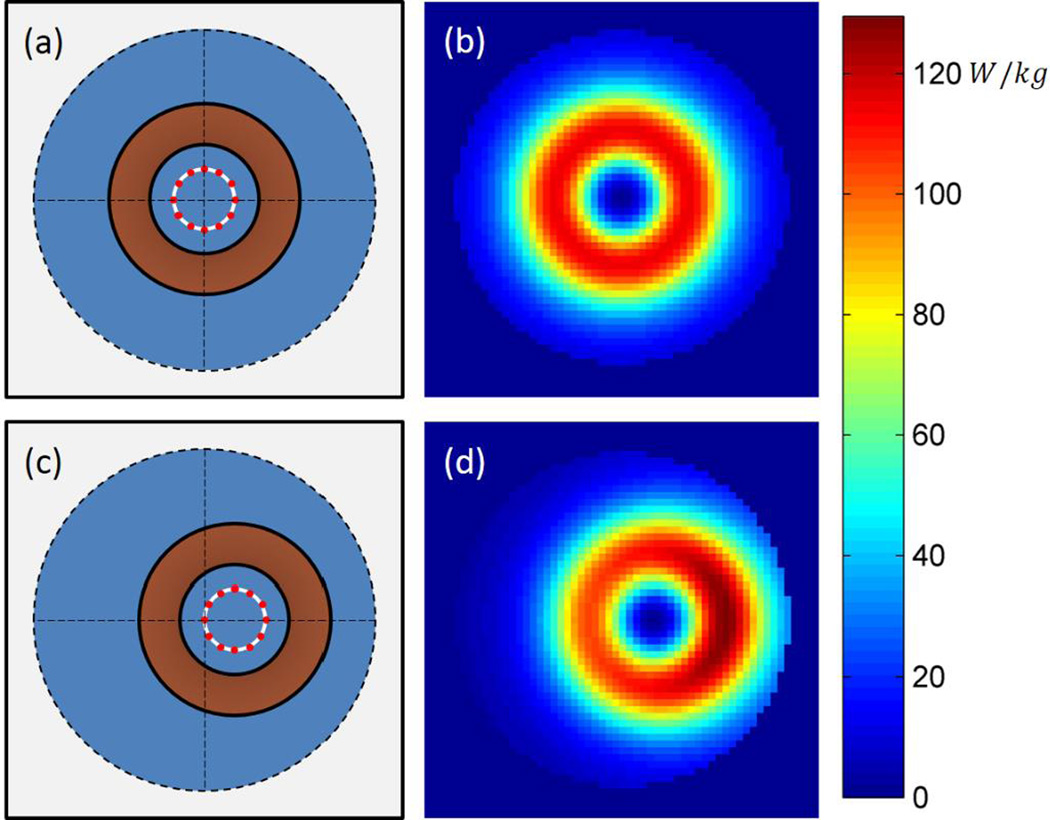
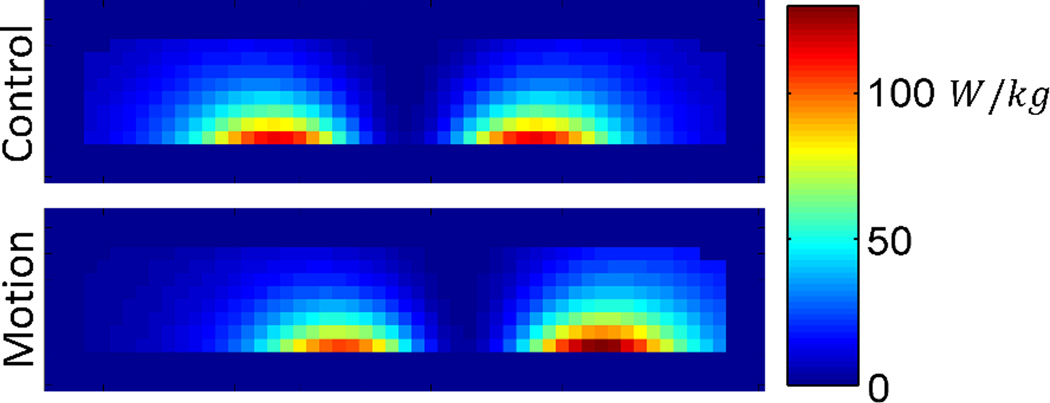
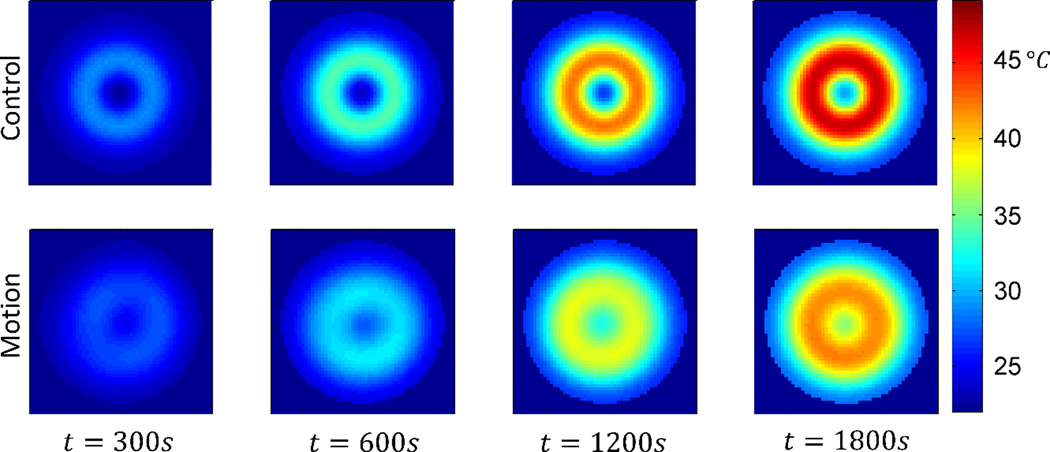
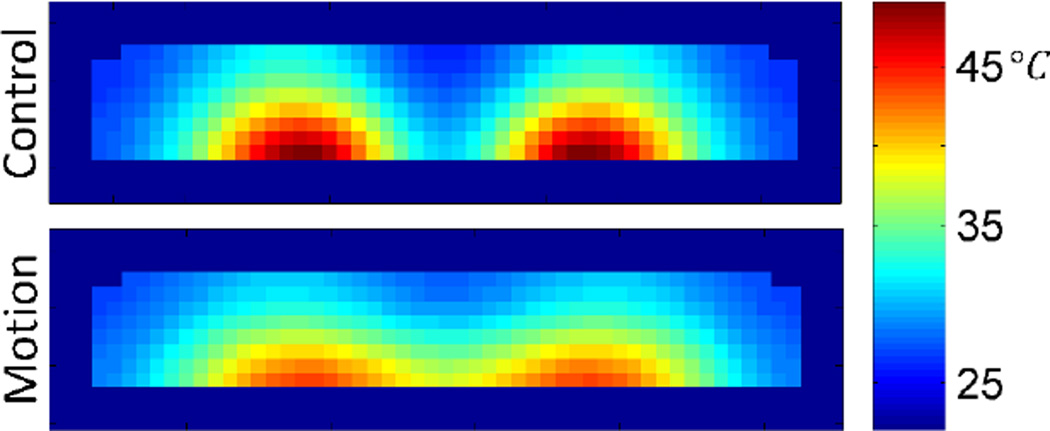
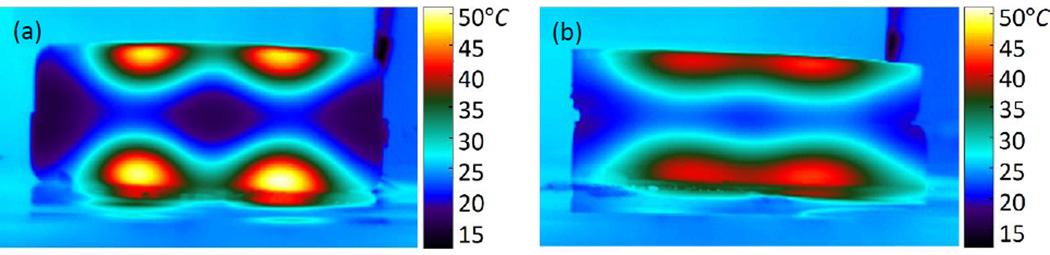
Methods: This paper presents two simple, clinically applicable techniques for decreasing maximum temperature induced by eddy currents. Computational and experimental results are presented to understand the underlying physics of eddy currents induced in conducting, biological tissues and leverage these insights to mitigate eddy current heating during MNP hyperthermia therapy.
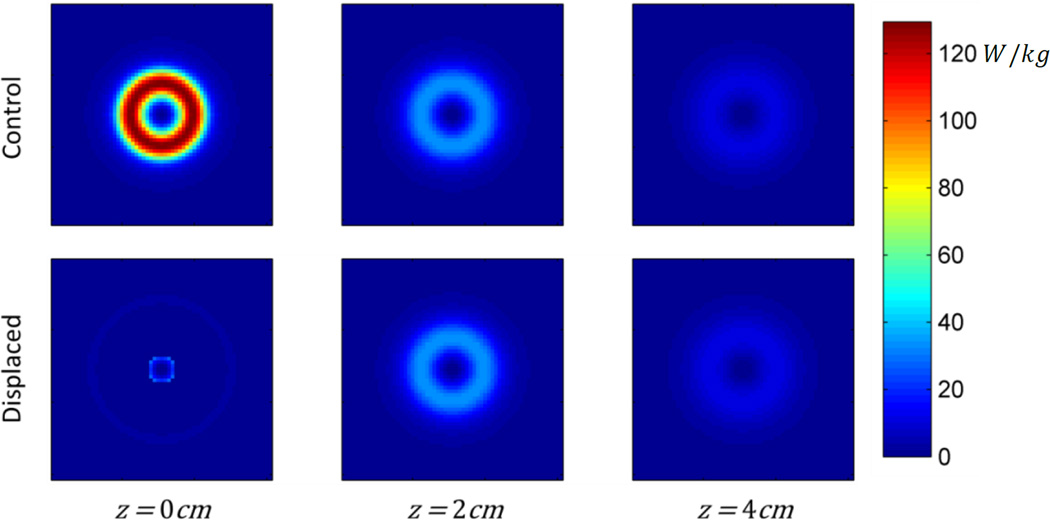
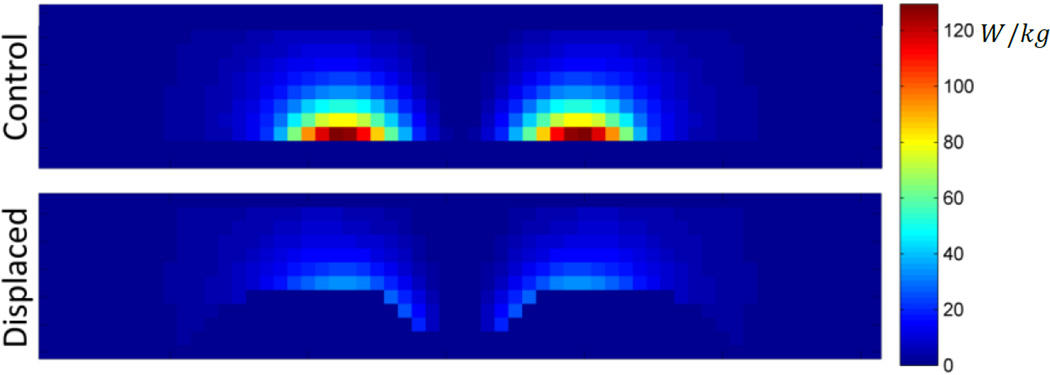
Results: Phantom studies show that the displacement and motion techniques reduce maximum temperature due to eddy currents by 74% and 19% in simulation, and by 77% and 33% experimentally.
Conclusion: Further study is required to optimise these methods for particular scenarios; however, these results suggest larger volumes of tissue could be treated, and/or higher field strengths and frequencies could be used to attain increased MNP heating when these eddy current mitigation techniques are employed.
Keywords: Eddy currents; Method of Auxiliary Sources; cancer therapy; hyperthermia; magnetic nanoparticle.
Figures
Similar articles
-
Design and Assessment of a Novel Biconical Human-Sized Alternating Magnetic Field Coil for MNP Hyperthermia Treatment of Deep-Seated Cancer.Cancers (Basel). 2023 Mar 8;15(6):1672. doi: 10.3390/cancers15061672. Cancers (Basel). 2023. PMID: 36980560 Free PMC article.
-
Mitigation of magnetic particle hyperthermia side effects by magnetic field controls.Int J Hyperthermia. 2021;38(1):511-522. doi: 10.1080/02656736.2021.1899310. Int J Hyperthermia. 2021. PMID: 33784924
-
Magnetic nanoparticle hyperthermia for treating locally advanced unresectable and borderline resectable pancreatic cancers: the role of tumor size and eddy-current heating.Int J Hyperthermia. 2020 Dec;37(3):108-119. doi: 10.1080/02656736.2020.1798514. Int J Hyperthermia. 2020. PMID: 33426990 Free PMC article.
-
Means to increase the therapeutic efficiency of magnetic heating of tumors.Biomed Tech (Berl). 2015 Oct;60(5):505-17. doi: 10.1515/bmt-2015-0052. Biomed Tech (Berl). 2015. PMID: 26351784 Review.
-
A review on hyperthermia via nanoparticle-mediated therapy.Bull Cancer. 2017 May;104(5):452-461. doi: 10.1016/j.bulcan.2017.02.003. Epub 2017 Apr 3. Bull Cancer. 2017. PMID: 28385267 Review.
Cited by
-
Design and construction of a Maxwell-type induction coil for magnetic nanoparticle hyperthermia.Int J Hyperthermia. 2020;37(1):1-14. doi: 10.1080/02656736.2019.1704448. Int J Hyperthermia. 2020. PMID: 31918595 Free PMC article.
-
Diagnostic and Therapeutic Approaches for Glioblastoma and Neuroblastoma Cancers Using Chlorotoxin Nanoparticles.Cancers (Basel). 2023 Jun 28;15(13):3388. doi: 10.3390/cancers15133388. Cancers (Basel). 2023. PMID: 37444498 Free PMC article. Review.
-
Design and Assessment of a Novel Biconical Human-Sized Alternating Magnetic Field Coil for MNP Hyperthermia Treatment of Deep-Seated Cancer.Cancers (Basel). 2023 Mar 8;15(6):1672. doi: 10.3390/cancers15061672. Cancers (Basel). 2023. PMID: 36980560 Free PMC article.
-
Validation of a coupled electromagnetic and thermal model for estimating temperatures during magnetic nanoparticle hyperthermia.Int J Hyperthermia. 2021;38(1):611-622. doi: 10.1080/02656736.2021.1913244. Int J Hyperthermia. 2021. PMID: 33853493 Free PMC article.
-
In Vitro and In Vivo Delivery of Magnetic Nanoparticle Hyperthermia using a Custom-Built Delivery System.J Vis Exp. 2020 Jul 2;(161):10.3791/61413. doi: 10.3791/61413. J Vis Exp. 2020. PMID: 32716383 Free PMC article.
References
-
- Oleson JR, Calderwood SK, Coughlin CT, Dewhirst MW, Gerweck LE, Gibbs FA, Kapp DS. Biological and clinical aspects of hyperthermia in cancer therapy. Am J Clin Oncol. 1988;11(3):368–380. - PubMed
-
- Sekhar KR, Sonar VN, Muthusamy V, Sasi S, Laszlo A, Sawani J, Horikoshi N, Higashikubo R, Bristow RG, Borrelli MJ, Crooks PA, Lepock JR, Roti Roti JL, Freeman ML. Novel chemical enhancers of heat shock increase thermal radiosensitization through a mitotic catastrophe pathway. Cancer Res. 2007;67(2):695–701. - PubMed
-
- Kampinga HH, Dikomey E. Hyperthermic radiosensitization: mode of action and clinical relevance. Int J Radiat Biol. 2001;77(4):399–408. - PubMed
Publication types
MeSH terms
Substances
Grants and funding
LinkOut - more resources
Full Text Sources
Other Literature Sources