. 2016 Aug;28(8):1910-25.
doi: 10.1105/tpc.16.00301. Epub 2016 Jul 19.

The Arabidopsis SR45 Splicing Factor, a Negative Regulator of Sugar Signaling, Modulates SNF1-Related Protein Kinase 1 Stability

Affiliations

The Arabidopsis SR45 Splicing Factor, a Negative Regulator of Sugar Signaling, Modulates SNF1-Related Protein Kinase 1 Stability

Raquel F Carvalho et al. Plant Cell. 2016 Aug.

Abstract

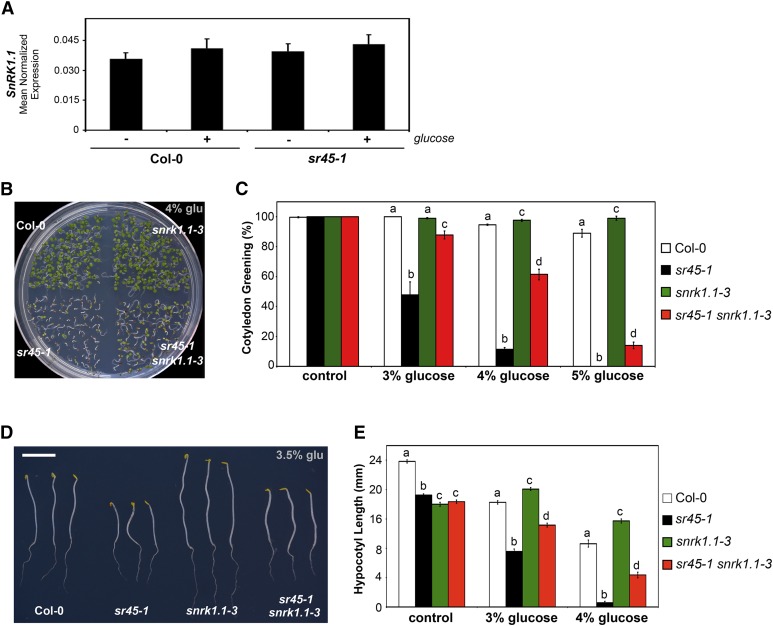
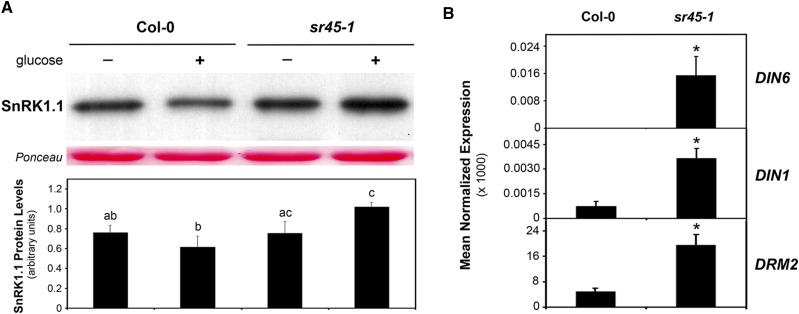
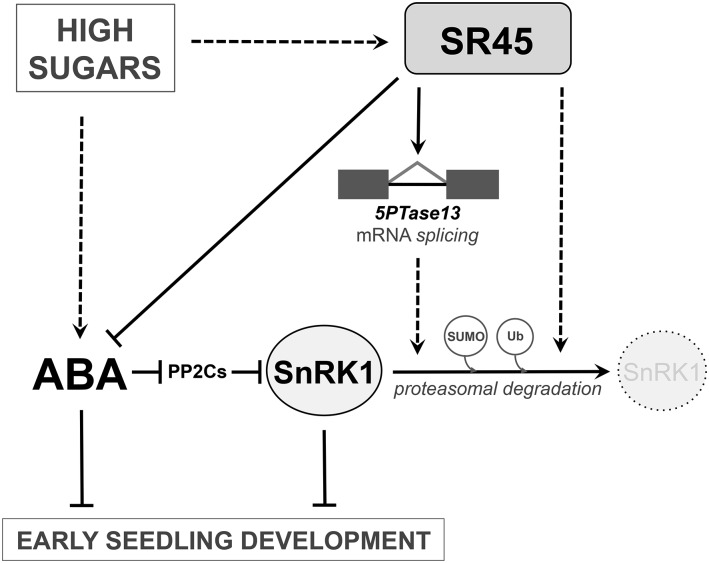
The ability to sense and respond to sugar signals allows plants to cope with environmental and metabolic changes by adjusting growth and development accordingly. We previously reported that the SR45 splicing factor negatively regulates glucose signaling during early seedling development in Arabidopsis thaliana Here, we show that under glucose-fed conditions, the Arabidopsis sr45-1 loss-of-function mutant contains higher amounts of the energy-sensing SNF1-Related Protein Kinase 1 (SnRK1) despite unaffected SnRK1 transcript levels. In agreement, marker genes for SnRK1 activity are upregulated in sr45-1 plants, and the glucose hypersensitivity of sr45-1 is attenuated by disruption of the SnRK1 gene. Using a high-resolution RT-PCR panel, we found that the sr45-1 mutation broadly targets alternative splicing in vivo, including that of the SR45 pre-mRNA itself. Importantly, the enhanced SnRK1 levels in sr45-1 are suppressed by a proteasome inhibitor, indicating that SR45 promotes targeting of the SnRK1 protein for proteasomal destruction. Finally, we demonstrate that SR45 regulates alternative splicing of the Arabidopsis 5PTase13 gene, which encodes an inositol polyphosphate 5-phosphatase previously shown to interact with and regulate the stability of SnRK1 in vitro, thus providing a mechanistic link between SR45 function and the modulation of degradation of the SnRK1 energy sensor in response to sugars.


Figures

Figure 1.
Figure 1.
HXK1 Dependency of the sr45-1 Glucose Phenotypes. (A) RT-qPCR analysis of HXK1 transcript levels in wild-type (Col-0) and sr45-1 mutant leaves treated or not with 1.5% glucose, using ACT2 as a reference gene. Results are from two independent experiments, and values represent means ± se (n = 4). Different letters indicate statistically significant differences (P < 0.05; Student’s t test). (B) Representative image of seedlings of the wild type (Col-0), the sr45-1, hxk1-1, and hxk1-2 single mutants, and the sr45-1 hxk1-1 and sr45-1 hxk1-2 double mutants, grown in the presence of 4% glucose for 7 d. (C) Cotyledon greening rates, scored 7 d after stratification, of seedlings of the wild type (Col-0), the sr45-1, hxk1-1, and hxk1-2 single mutants, and the sr45-1 hxk1-1 and sr45-1 hxk1-2 double mutants, grown under control conditions or in the presence of 4% glucose (means ± se, n = 3). Different letters indicate statistically significant differences between genotypes under each condition (P < 0.05; Student’s t test). (D) Representative image of seedlings of the wild type (Col-0), the sr45-1, hxk1-1, and hxk1-2 single mutants, and the sr45-1 hxk1-1 and sr45-1 hxk1-2 double mutants, grown in the dark in the presence of 3.5% glucose for 7 d. Bar = 8 mm. (E) Hypocotyl length, measured 7 d after stratification, of seedlings of the wild type (Col-0), the sr45-1, hxk1-1, and hxk1-2 single mutants, and the sr45-1 hxk1-1 and sr45-1 hxk1-2 double mutants, grown in the dark under control conditions or in the presence of 3 or 4% glucose (means ± se, n = 30-60). Different letters indicate statistically significant differences between genotypes under each condition (P < 0.05; Student’s t test).
Figure 2.
Figure 2.
SnRK1.1 Dependency of the sr45-1 Glucose Phenotypes. (A) RT-qPCR analysis of SnRK1.1 transcript levels in wild-type (Col-0) and sr45-1 mutant leaves incubated in the absence or presence of 1.5% glucose, using ACT2 as a reference gene. Results are from two independent experiments and values represent means ± se (n = 4). No statistically significant differences between samples were detected (P > 0.05; Student’s t test). (B) Representative image of seedlings of the wild type (Col-0), the sr45-1 and snrk1.1-3 single mutants, and the sr45-1 snrk1.1-3 double mutant grown in the presence of 4% glucose for 7 d. (C) Cotyledon greening rates, scored 7 d after stratification, of seedlings of the wild type (Col-0), the sr45-1 and snrk1.1-3 single mutants, and the sr45-1 snrk1.1-3 double mutant, grown under control conditions or in the presence of 3, 4, or 5% glucose (means ± se, n = 3). Different letters indicate statistically significant differences between genotypes under each condition (P < 0.05; Student’s t test). (D) Representative image of seedlings of the wild type (Col-0), the sr45-1 and snrk1.1-3 single mutants, and the sr45-1 snrk1.1-3 double mutant, grown in the dark in the presence of 3.5% glucose for 7 d. Bar = 10 mm. (E) Hypocotyl length, measured 7 d after stratification, of seedlings of the wild type (Col-0), the sr45-1 and snrk1.1-3 single mutants, and the sr45-1 snrk1.1-3 double mutant, grown in the dark under control conditions or in the presence of 3 or 4% glucose (means ± se, n = 40-60). Different letters indicate statistically significant differences between genotypes under each condition (P < 0.05; Student’s t test).
Figure 3.
Figure 3.
SR45 Modulation of SnRK1.1 Protein Levels and SnRK1.1-Activated Genes. (A) Protein gel blot analysis of SnRK1.1 levels in wild-type (Col-0) and sr45-1 mutant leaves incubated in the absence or presence of 1.5% glucose. Bands were quantified and relative protein levels determined using the Ponceau loading control as a reference. The blot image is representative of four independent experiments, and the bar graph shows means ± se of SnRK1.1 protein levels in all assays (n = 4). Different letters indicate statistically significant differences (P < 0.05; Student’s t test). (B) RT-qPCR analysis of the transcript levels of SnRK1.1 marker genes DIN6, DIN1, and DRM2 in wild-type (Col-0) and sr45-1 mutant leaves incubated in the presence of 1.5% glucose, using EF1A as a reference gene. Results are from two independent experiments, and values represent means ± se (n = 4). Asterisks indicate statistically significant differences from the wild type (P < 0.05; Student’s t test).
Figure 4.
Figure 4.
Distribution Profiles for Gene Functional Category and Alternative Splicing Event of the SR45 Targets Identified by the AS RT-PCR Panel. (A) Percentage of functional distribution of the total genes included in the RT-PCR panel and of the genes showing significant alternative splicing (AS) changes (>3%, P < 0.05) between wild-type (Col-0) and sr45-1 mutant seedlings grown under control conditions or in the presence of 3% glucose. Statistical analysis indicated no significant changes between profiles (P > 0.05, Fisher’s exact test with Bonferroni correction for multiple testing). (B) Percentage of distribution of the different types of AS events among the total AS events analyzed by the RT-PCR panel and the AS events showing significant changes (>3%, P < 0.05) between wild-type (Col-0) and sr45-1 mutant seedlings grown under control conditions or in the presence of 3% glucose. The asterisk indicates a significant difference from the total of events in the panel (P < 0.05, Fisher’s exact test with Bonferroni correction for multiple testing).
Figure 5.
Figure 5.
Effect of sr45-1 Mutation on Alternative Splicing of the SR45 Pre-mRNA. (A) Schematic diagram of two splice variants (SR45.1 and SR45.2) produced by the Arabidopsis SR45 gene. Boxes represent exons with untranslated regions in black, lines represent introns, and the inverted triangle indicates the position of the T-DNA insertion in the sr45-1 mutant allele. The arrows indicate the location of the primer pair used in the RT-PCR panel, where the sizes of the PCR products obtained for the SR45.1 and SR45.2 splice variants were 177 and 156 bp, respectively. (B) Histogram showing the ratio between the abundance of the SR45.1 and SR45.2 splice variants in wild-type (Col-0) and sr45-1 mutant seedlings grown under control conditions or in the presence of 3% glucose (means ± se, n = 4). Different letters indicate statistically significant differences (P < 0.05, Student’s t test).
Figure 6.
Figure 6.
Effect of SR45 on SnRK1.1 Proteasomal Degradation. Protein gel blot analysis of SnRK1.1 levels in leaves treated with 1.5% glucose in the absence or presence of 100 µM of the protein synthesis inhibitor cycloheximide (CHX) or of 50 μM of the proteasome inhibitor MG132 (Ponceau-stained membrane is shown as a loading control).
Figure 7.
Figure 7.
SR45 Regulation of Alternative Splicing of the 5PTase13 Pre-mRNA. (A) Schematic diagram of two splice variants (5PTase13.1 and 5PTase13.2) produced by the Arabidopsis 5PTase13 gene. Boxes represent exons with untranslated regions in black, lines represent introns, and arrows indicate the location of the 5PTase13 F1 and R1 primers. (B) RT-PCR analysis of 5PTase13 transcript levels in wild-type (Col-0) and sr45-1 mutant leaves incubated in the presence of 1.5% glucose. The location of the F1 and R1 primers used is shown in (A). Expression of the ACT2 gene is shown as a loading control. (C) RT-qPCR analysis of total 5PTase13 expression as well as 5PTase13.1 transcript levels (different y axis scales) in wild-type (Col-0) and sr45-1 mutant leaves incubated in the absence or presence of 1.5% glucose, using EF1A as a reference gene (upper panel). The expression ratio between 5PTase13.1 and total 5PTase13 is also shown (lower panel). Results are from two independent experiments and values represent means ± se (n = 4). Different letters indicate statistically significant differences (P < 0.05; Student’s t test).
Figure 8.
Figure 8.
Model of SR45-Mediated Sugar Signaling during Early Seedling Development. High sugar levels lead to an ABA-mediated early growth arrest in Arabidopsis. SR45 negatively regulates sugar signaling by repressing glucose-induced ABA accumulation (Carvalho et al., 2010). One component contributing to the regulation of sugar signaling by SR45 is the SnRK1 protein kinase, which is activated by ABA in a PP2C-dependent manner (Rodrigues et al., 2013) and whose overexpression in young Arabidopsis seedlings causes glucose and ABA hypersensitivity (Jossier et al., 2009; Tsai and Gazzarrini, 2012). SnRK1 activity is also regulated via SUMOylation/ubiquitination and subsequent degradation by the 26S proteasome (Lee at al., 2008; Crozet et al., 2016). The SR45 SR-like protein regulates SnRK1 protein levels in response to sugars by modulating alternative splicing of the 5PTase13 pre-mRNA, encoding a modulator of SnRK1 proteasomal degradation (Ananieva et al., 2008), where excision of intron 6 promotes destabilization of the SnRK1 protein. Alternatively, SR45 could play a direct role in SnRK1 degradation via a nonsplicing function.

Similar articles

Cited by

References

    1. Aki T., Konishi M., Kikuchi T., Fujimori T., Yoneyama T., Yanagisawa S. (2007). Distinct modulations of the hexokinase1-mediated glucose response and hexokinase1-independent processes by HYS1/CPR5 in Arabidopsis. J. Exp. Bot. 58: 3239–3248. - PubMed
    1. Ali G.S., Reddy A.S. (2006). ATP, phosphorylation and transcription regulate the mobility of plant splicing factors. J. Cell Sci. 119: 3527–3538. - PubMed
    1. Ali G.S., Golovkin M., Reddy A.S. (2003). Nuclear localization and in vivo dynamics of a plant-specific serine/arginine-rich protein. Plant J. 36: 883–893. - PubMed
    1. Ali G.S., Prasad K.V., Hanumappa M., Reddy A.S. (2008). Analyses of in vivo interaction and mobility of two spliceosomal proteins using FRAP and BiFC. PLoS One 3: e1953. - PMC - PubMed
    1. Ali G.S., Palusa S.G., Golovkin M., Prasad J., Manley J.L., Reddy A.S. (2007). Regulation of plant developmental processes by a novel splicing factor. PLoS One 2: e471. - PMC - PubMed

MeSH terms

Substances