. 2016 Aug;28(8):1860-78.
doi: 10.1105/tpc.16.00143. Epub 2016 Jul 19.

Regulation of Leaf Starch Degradation by Abscisic Acid Is Important for Osmotic Stress Tolerance in Plants

Affiliations

Regulation of Leaf Starch Degradation by Abscisic Acid Is Important for Osmotic Stress Tolerance in Plants

Matthias Thalmann et al. Plant Cell. 2016 Aug.

Abstract

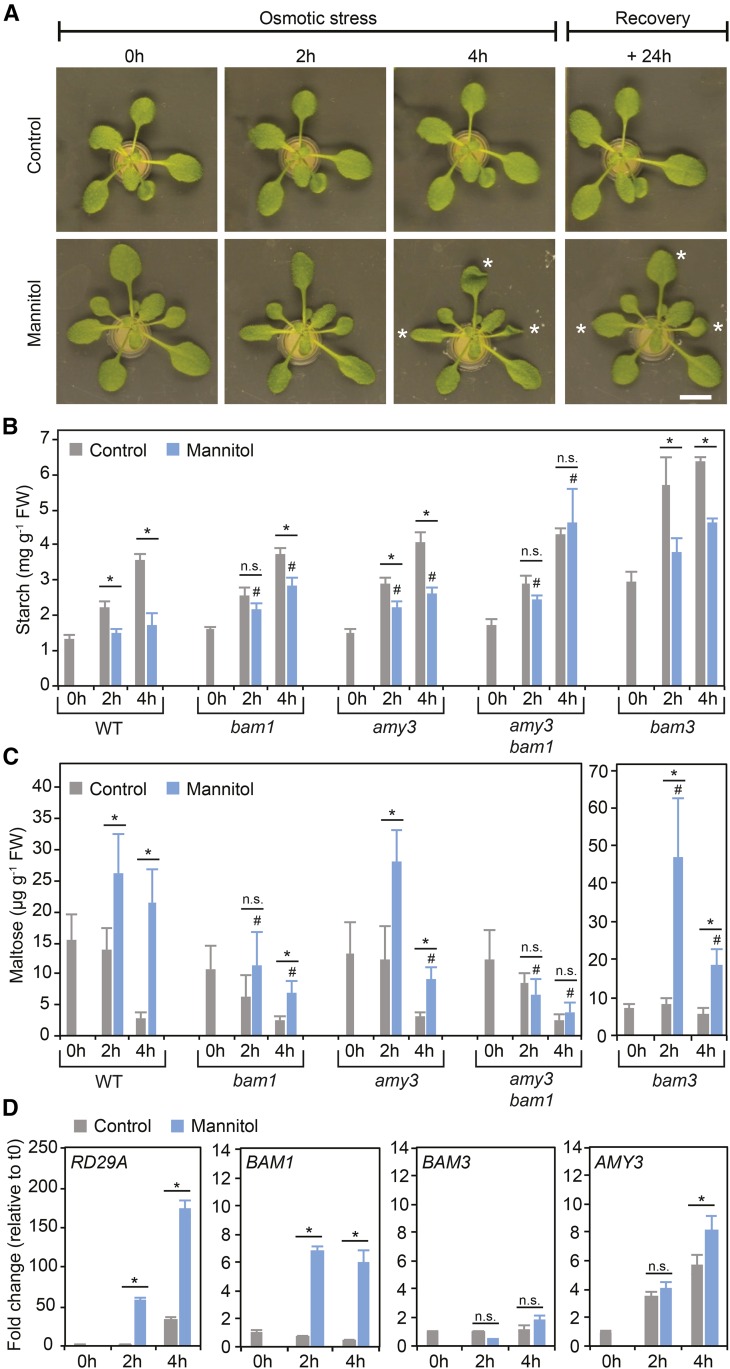
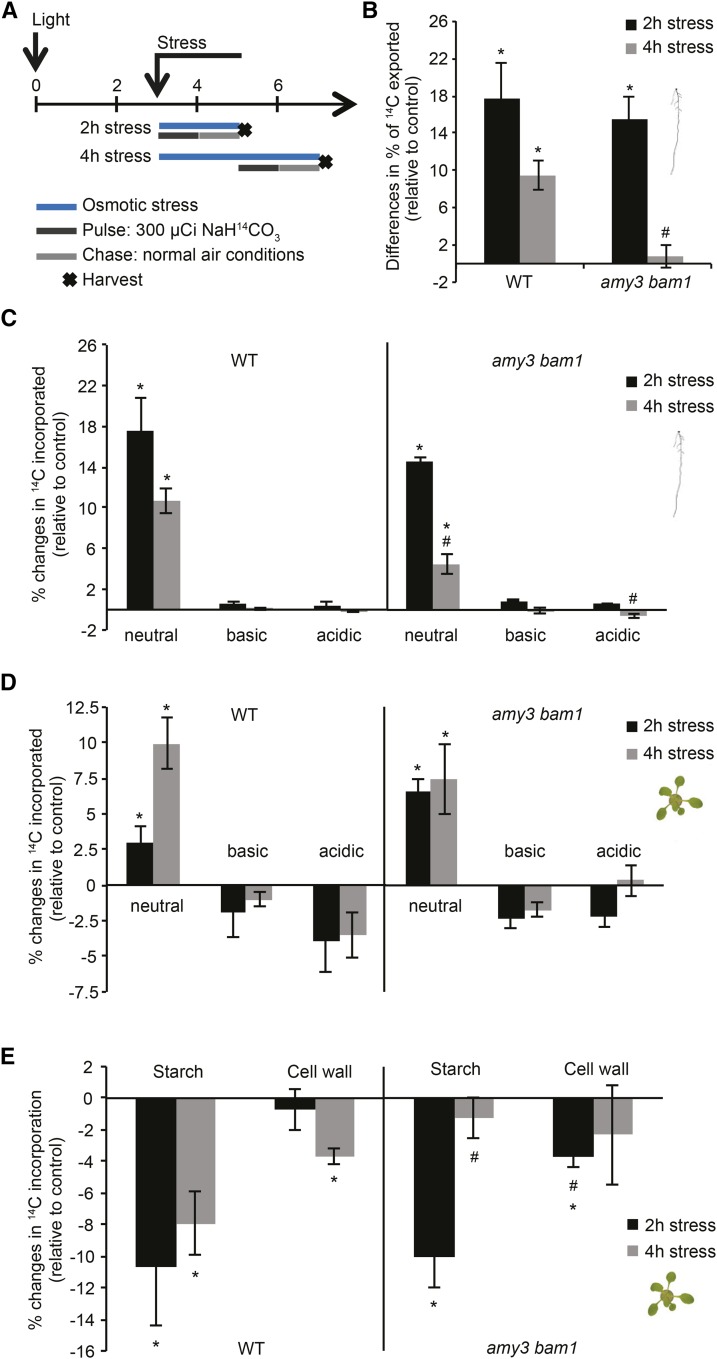
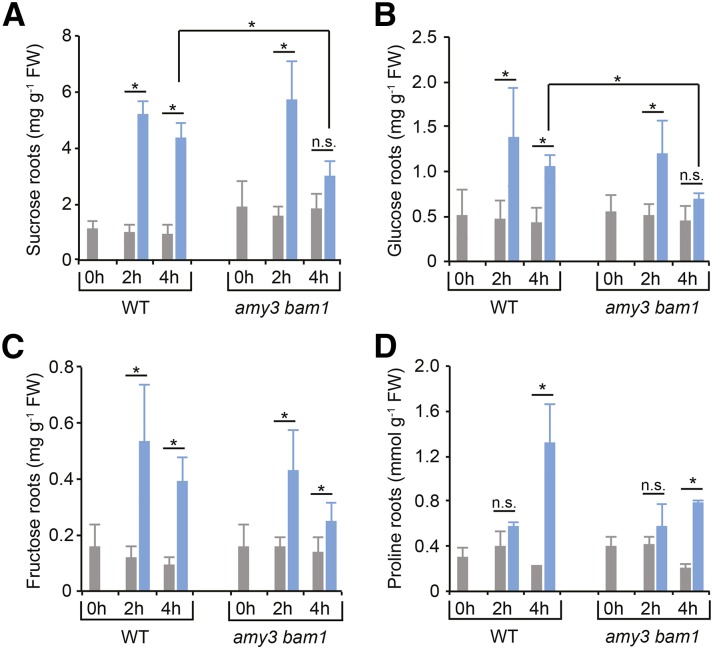
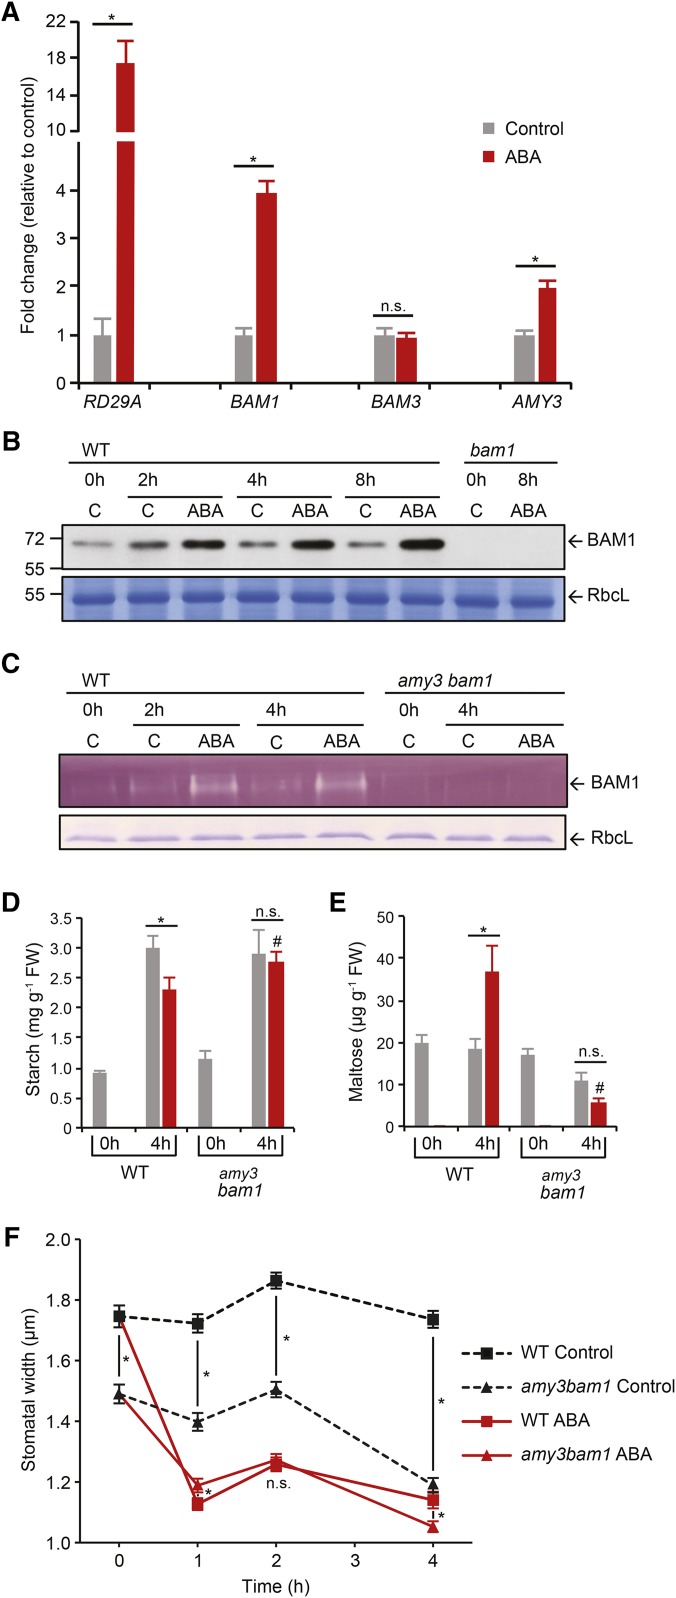
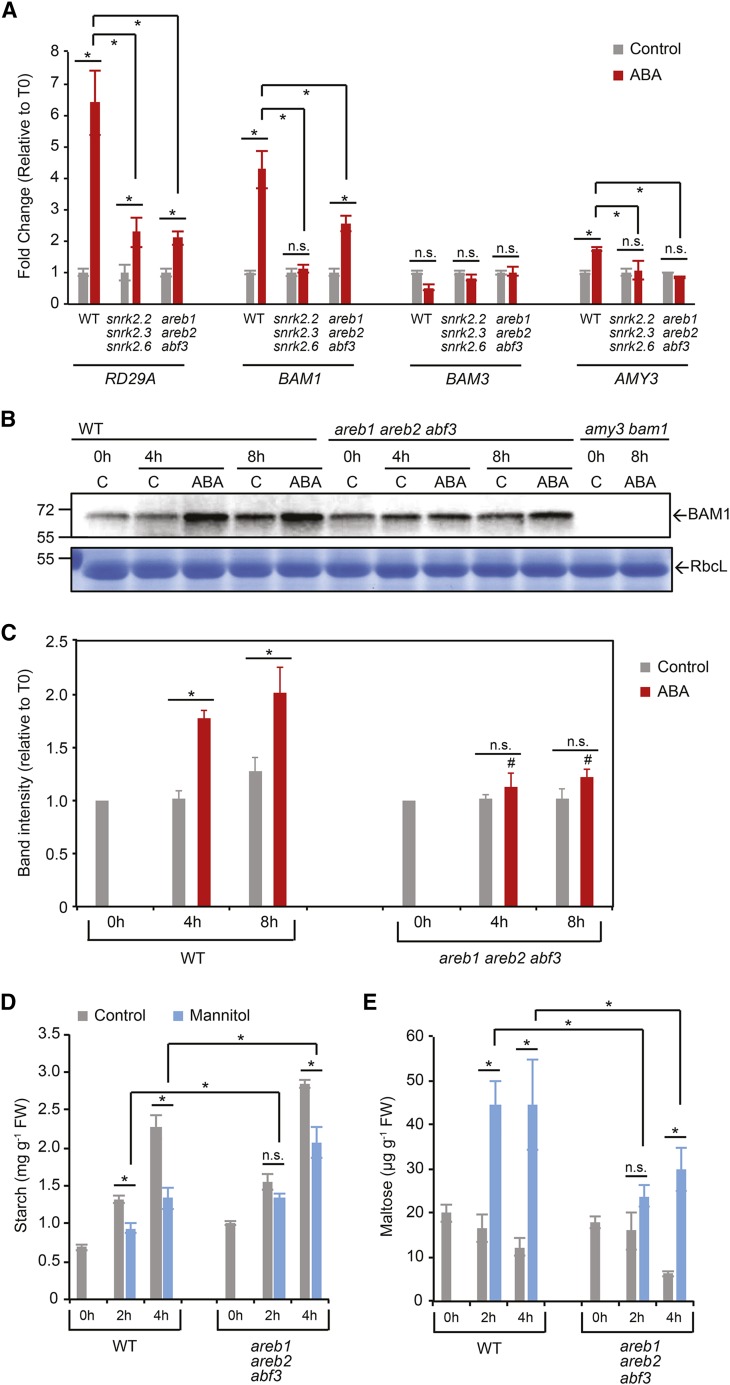
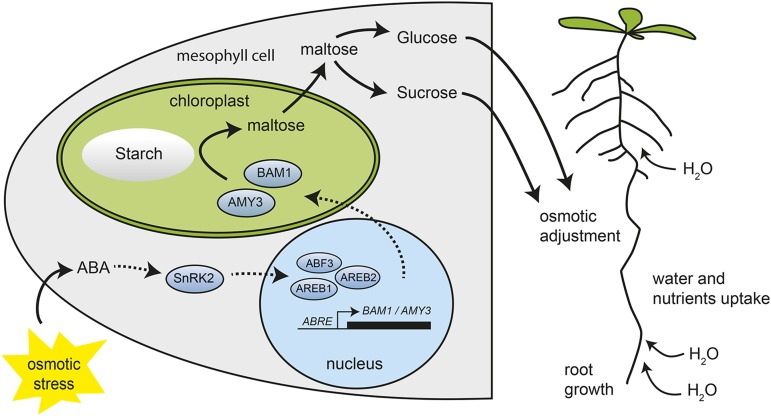
Starch serves functions that range over a timescale of minutes to years, according to the cell type from which it is derived. In guard cells, starch is rapidly mobilized by the synergistic action of β-AMYLASE1 (BAM1) and α-AMYLASE3 (AMY3) to promote stomatal opening. In the leaves, starch typically accumulates gradually during the day and is degraded at night by BAM3 to support heterotrophic metabolism. During osmotic stress, starch is degraded in the light by stress-activated BAM1 to release sugar and sugar-derived osmolytes. Here, we report that AMY3 is also involved in stress-induced starch degradation. Recently isolated Arabidopsis thaliana amy3 bam1 double mutants are hypersensitive to osmotic stress, showing impaired root growth. amy3 bam1 plants close their stomata under osmotic stress at similar rates as the wild type but fail to mobilize starch in the leaves. (14)C labeling showed that amy3 bam1 plants have reduced carbon export to the root, affecting osmolyte accumulation and root growth during stress. Using genetic approaches, we further demonstrate that abscisic acid controls the activity of BAM1 and AMY3 in leaves under osmotic stress through the AREB/ABF-SnRK2 kinase-signaling pathway. We propose that differential regulation and isoform subfunctionalization define starch-adaptive plasticity, ensuring an optimal carbon supply for continued growth under an ever-changing environment.


Figures

Figure 1.
Figure 1.
Leaf Starch Levels during Osmotic Stress Are Unchanged in amy3 bam1 Mutant Plants. (A) Three-week-old hydroponically grown Arabidopsis plants were transferred to a nutrient solution optionally supplemented with 300 mM mannitol for 4 h. After the stress treatment, roots were rinsed with water and returned to a control solution for 24 h. Representative wild-type plants (Col-0) show the reduction in turgor in response to mannitol stress (denoted by asterisks) from which the plants recovered after 24 h in control nutrient solution. Bar = 1 cm. (B) and (C) Leaf starch (B) and maltose (C) content in osmotically stressed leaves compared with controls. Values are means ± se (n = 8). FW, fresh weight. (D) Leaf transcript abundance for BAM1, BAM3, and AMY3 in osmotically stressed and control leaves, determined by qPCR. Plants grown as above were harvested at the indicated time points. The ACT2 gene was used as a reference gene. RD29A was used as a positive stress-induced control. Values were normalized against gene expression at T0 (set as 1) and represent means ± se (n = 3). Statistical significances determined by unpaired two-tailed Student’s t tests: *P < 0.05 for the indicated comparison; #P < 0.05 mutants versus the wild type at the indicated time points; n.s., not significant for the indicated comparison.
Figure 2.
Figure 2.
Effects of Osmotic Stress on amy3 bam1 Double Mutants. (A) Leaf relative water content of wild-type and amy3 bam1 plants subject to mannitol stress or kept in control solution was determined at the indicated time points as described in Methods. Values are means ± se (n = 6). (B) Osmolality of wild-type and amy3 bam1 leaf sap. Values are means ± se (n = 6). (C) Stomatal closure in response to mannitol treatment in wild type and amy3 bam1 plants. Epidermal peels isolated from leaves of hydroponically grown plants treated with mannitol for 4 h or kept in a control nutrient solution were used for stomatal width measurements. Values are means ± se (n = 4 biological replicates with more than 50 individual stomata measured for each time point). (D) Morphology of wild-type and amy3 bam1 plants under control (top panel) and osmotic stress conditions (bottom panel). Plants were grown in control medium for 6 d, transferred to medium optionally supplemented with 300 mM mannitol, and photographed 3 d later. Bar = 1 cm. (E) Shoot and root fresh weights (FW) measured 9 d after seedling transfer as described in (D). Values represent the FW of osmotically stressed plants compared with control plants (set as 100%). Values are means ± se (n = 15). (F) Root to shoot ratio of wild-type and amy3 bam1 plants in response to 300 mM mannitol stress. Values are derived from the data shown in (E). Statistical significances determined by unpaired two-tailed Student’s t tests: *P < 0.05 for the indicated comparison; n.s., not significant for the indicated comparison.
Figure 3.
Figure 3.
Carbon Partitioning in Wild-Type and amy3 bam1 Plants during Osmotic Stress. (A) Scheme of labeling set up. Whole wild-type and amy3 bam1 plants were labeled with 14CO2 for 1 h, just after transfer to a mannitol-containing nutrient solution or at the middle of the stress treatment. Following a 1-h chase period, the shoot and root were harvested separately and the 14C in the different tissue fractions determined by scintillation counting. (B) Carbon export to the roots of osmotically stressed and control plants. Relative changes in 14C imported into the root upon osmotic stress are given as percentages of that imported under control conditions (set as 0). Values are means ± se (n = 4). (C) Incorporation of 14C into the different water-soluble fractions of wild-type and amy3 bam1 roots. Relative changes in the amount of 14C incorporated into the different fractions upon osmotic stress are given as percentages of that in corresponding fractions under control conditions (set as 0). Values are means ± se (n = 4). (D) Incorporation of 14C into the different water-soluble fractions of wild-type and amy3 bam1 shoots in plants subject to osmotic stress compared with controls. Relative changes are expressed as described above for (C). (E) Incorporation of 14C into starch and cell wall compounds of wild-type and amy3 bam1 shoots in plants subject to osmotic stress compared with control. Relative changes are expressed as described above for (C). Statistical significances determined by unpaired two-tailed Student’s t tests: *P < 0.05 for the indicated comparison; #P < 0.05 mutant versus the wild type at the indicated time points; n.s., not significant.
Figure 4.
Figure 4.
Quantification of Soluble Sugars and Proline in Roots of Osmotically Stressed Plants. Sucrose (A), glucose (B), fructose (C), and proline (D) content in roots of wild-type and amy3 bam1 plants in response to osmotic stress treatment. Hydroponically grown plants were optionally supplemented with 300 mM mannitol for 4 h. Value are means ± se (n = 5). FW, fresh weight. Statistical significances determined by unpaired two-tailed Student’s t tests: *P < 0.05 for the indicated comparison; n.s., not significant for the indicated comparison.
Figure 5.
Figure 5.
Effects of Exogenous ABA on Leaf Starch Metabolism. (A) Relative expression levels of BAM1, BAM3, and AMY3 in wild type leaves 4 h after treatment with 100 μM ABA, determined by qPCR. The ACT2 gene served as a reference gene. RD29A served as a positive control for the ABA treatment. Values representing means ± se (n = 3) were normalized against gene expression in control conditions (set as 1). (B) Immunodetection of BAM1 protein in wild-type leaves after ABA treatment. Total protein was extracted from rosettes of hydroponically grown plants at the indicated time points. Equal protein amounts were separated by SDS-PAGE. The Rubisco large subunit (RbcL), the dominant band visualized by Coomassie staining, confirmed uniform loading. BAM1 was detected using polyclonal antibodies raised against recombinant BAM1. Extracts of the bam1 mutant served as a negative control. Replicate blots yielded the same result. C, mock-treated control. (C) ABA-mediated changes in BAM1 activity. Leaf crude extracts from hydroponically grown wild-type and amy3 bam1 plants harvested 4 h after ABA treatment were separated by native PAGE in gels containing 0.1% amylopectin. After electrophoresis and incubation for 2 h (see Methods), the gels were stained in Lugol’s solution. BAM1 activity was detected in wild-type but not amy3 bam1 plants. (D) and (E) Leaf starch (D) and maltose (E) content in wild-type and amy3 bam1 plants 4 h after ABA treatment, compared with controls. Values are means ± se (n = 6). FW, fresh weight. (F) Stomatal closure in response to ABA treatment in wild-type and amy3 bam1 plants. Epidermal peels isolated from leaves of hydroponically grown plants treated with ABA 100 μM for 4 h or kept in a control nutrient solution were used for stomatal width measurements. Values are means ± se (n = 4 biological replicates with more than 50 individual stomata measured for each time point). Stomatal width under control conditions is the same as in Figure 2C, as the experiments were conducted in parallel. Statistical significances determined by unpaired two-tailed Student’s t tests: *P < 0.05 for the indicated comparison; #P < 0.05 mutant versus the wild type at the indicated time points; n.s., not significant for the indicated comparison.
Figure 6.
Figure 6.
Leaf Starch Degradation during Osmotic Stress Is Blocked in the ABA-Deficient Mutant nced3. (A) and (B) Leaf starch (A) and maltose (B) content in wild-type, nced3, and aao3 plants treated with 300 mM mannitol compared with controls. Values are means ± se (n = 6). FW, fresh weight. (C) Relative expression levels of BAM1, BAM3, and AMY3 in leaves of wild-type, nced3, and aao3 plants treated with 300 mM mannitol for 4 h, determined by qPCR. The ACT2 gene served as a reference gene. RD29A served as a positive control for the osmotic stress treatment. Values representing means ± se (n = 3) were normalized against gene expression in control conditions (set as 1). Statistical significances determined by unpaired two-tailed Student’s t tests: *P < 0.05 for the indicated comparison; n.s., not significant for the indicated comparison.
Figure 7.
Figure 7.
AREB1, AREB2, and ABF3 Transcription Factors Regulate BAM1 and AMY3 Expression in Response to Osmotic Stress. (A) Relative expression levels of BAM1, BAM3, and AMY3 in the wild type and areb1 areb2 abf3 triple mutant leaves 4 h after treatment with 100 μM ABA, determined by qPCR. The ACT2 gene served as a reference gene. RD29A served as a positive control for the ABA treatment. Values representing means ± se (n = 3) were normalized against gene expression in control conditions (set as 1). (B) Immunodetection of BAM1 protein in wild-type, areb1 areb2 abf3, and amy3 bam1 leaves after ABA treatment. Total protein was extracted from rosettes of hydroponically grown plants at the indicated time points. Equal amounts of protein were separated by SDS-PAGE and the Rubisco large subunit (RbcL) was used for confirmation. BAM1 was detected using polyclonal antibody raised against recombinant BAM1. Replicate blots yielded the same result. C, control. (C) BAM1 protein quantification. Densitometry analysis (ImageJ) was used to quantify band intensities such as in (B). Values are means ± se of three biological samples, each analyzed with three technical replicates, and expressed relative to the mean band intensity at time 0 (T0, set as 1). (D) and (E) Starch (D) and maltose (E) content in wild-type and areb1 areb2 abf3 plants subject to mannitol stress compared with controls. Values are means ± se (n = 6). FW, fresh weight. Statistical significances determined by unpaired two-tailed Student’s t tests: *P < 0.05 for the indicated comparison; #P < 0.05 mutant versus the wild type at the indicated time points; n.s., not significant for the indicated comparison.
Figure 8.
Figure 8.
Unbiased Bioinformatics Analysis of BAM1 Ortholog Promoter Sequences. (A) and (B) The 1.5-kb promoter regions of BAM1-like genes from 30 angiosperm species were analyzed using the MEME algorithm (http://meme.nbcr.net). The conserved sequence logos of the ABREs and CE3-like found by MEME are depicted in (A) and (B), respectively. The diagram provides an idea of which positions in the motif are most highly conserved (measured in bits). Highly conserved positions in the motif have higher bits. (C) Distribution of ABRE and CE3-like cis-regulatory elements within the analyzed promoters.
Figure 9.
Figure 9.
Proposed Model of Starch Degradation Mechanism and Regulation during Osmotic Stress. In response to stress, ABA triggers BAM1 and AMY3 transcription through the ABA-dependent AREB/ABF-SnRK2 signaling pathway. This leads to rapid de novo BAM1 protein synthesis and increased amylolytic activity, although posttranslational modifications are also likely to contribute. A fraction of the maltose released from starch by the synergistic action of BAM1 and AMY3 is exported to the cytosol and metabolized into sucrose and free hexoses. Sucrose is then exported to the root to support osmotic adjustment, water and nutrient uptake, and root growth. The remaining sugars, including some maltose and the additional sugars originating from carbon assimilation, are retained in the leaves for osmotic adjustment, energy supply, and to protect the photosynthetic apparatus from oxidative stress.

Comment in

Similar articles

Cited by

References

    1. Baerenfaller K., Hirsch-Hoffmann M., Svozil J., Hull R., Russenberger D., Bischof S., Lu Q., Gruissem W., Baginsky S. (2011). pep2pro: a new tool for comprehensive proteome data analysis to reveal information about organ-specific proteomes in Arabidopsis thaliana. Integr. Biol. (Camb.) 3: 225–237. - PubMed
    1. Bailey T.L., Boden M., Buske F.A., Frith M., Grant C.E., Clementi L., Ren J., Li W.W., Noble W.S. (2009). MEME SUITE: tools for motif discovery and searching. Nucleic Acids Res. 37: W202–W208. - PMC - PubMed
    1. Bartels D., Sunkar R. (2005). Drought and salt tolerance in plants. CRC. Crit. Rev. Plant Sci. 24: 23–58.
    1. Bates L.S., Waldren R.P., Teare I.D. (1973). Rapid determination of free proline for water-stress studies. Plant Soil 39: 205–207.
    1. Blatt M.R. (2016). Plant physiology: redefining the enigma of metabolism in stomatal movement. Curr. Biol. 26: R107–R109. - PubMed

MeSH terms