. 2016 Dec;8(6):518-529.
doi: 10.1093/jmcb/mjw035. Epub 2016 Jul 19.

Prostaglandin E2 receptor EP3 regulates both adipogenesis and lipolysis in mouse white adipose tissue

Affiliations

Prostaglandin E2 receptor EP3 regulates both adipogenesis and lipolysis in mouse white adipose tissue

Hu Xu et al. J Mol Cell Biol. 2016 Dec.

Abstract

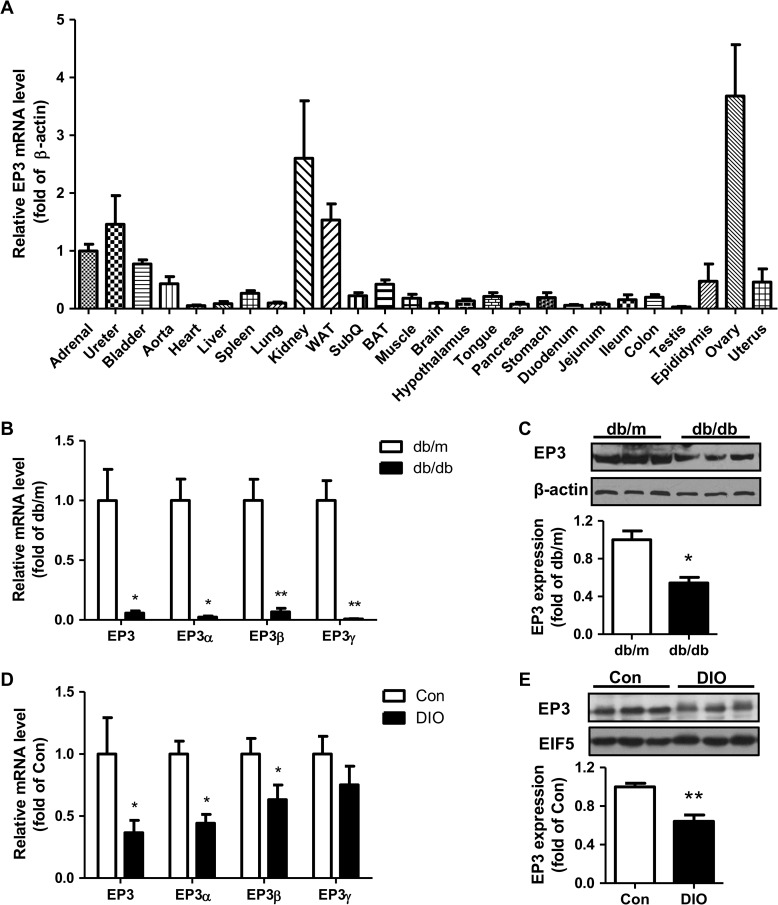
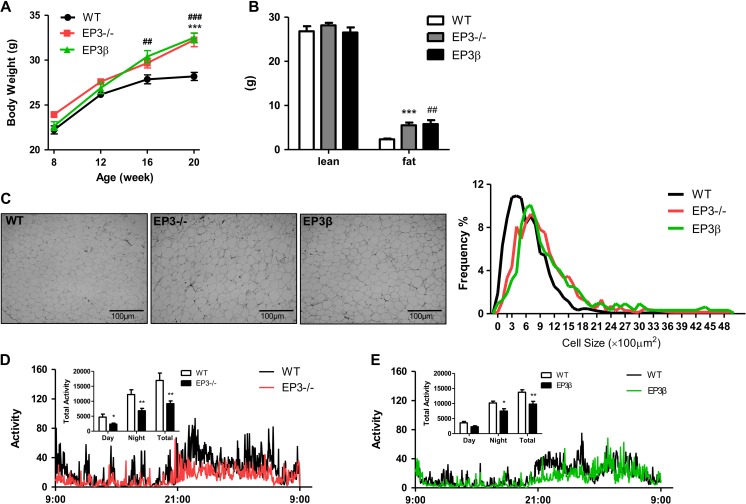
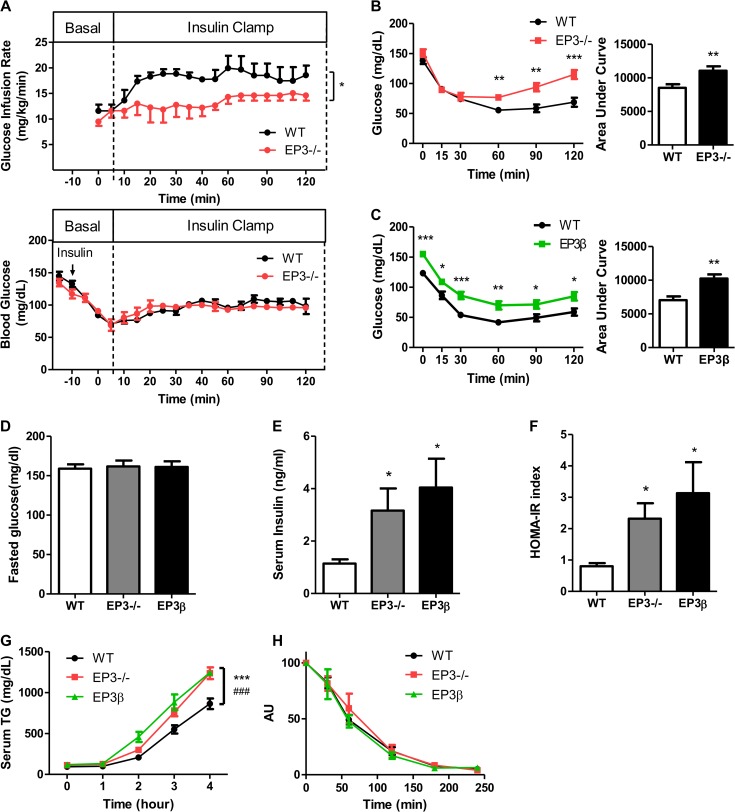
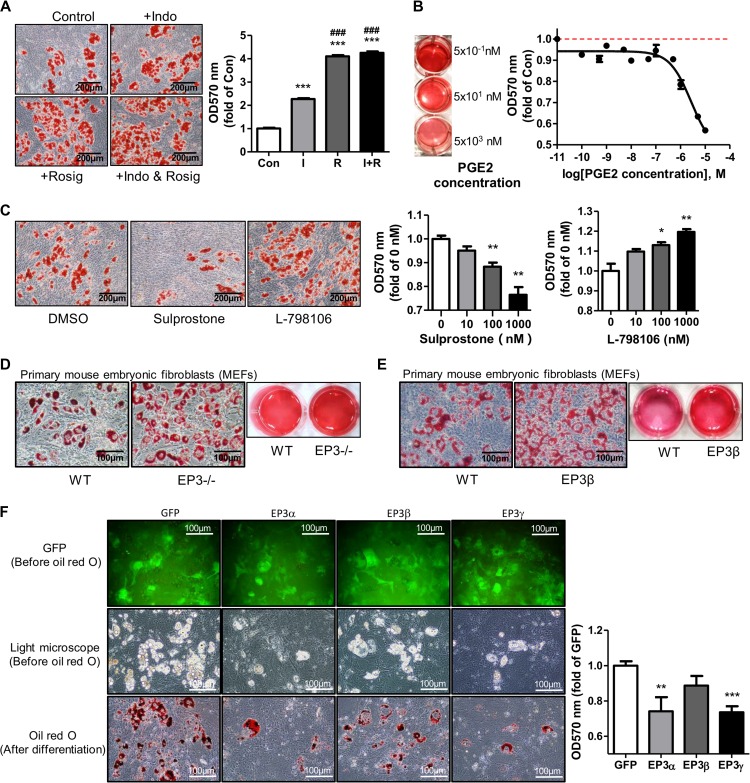
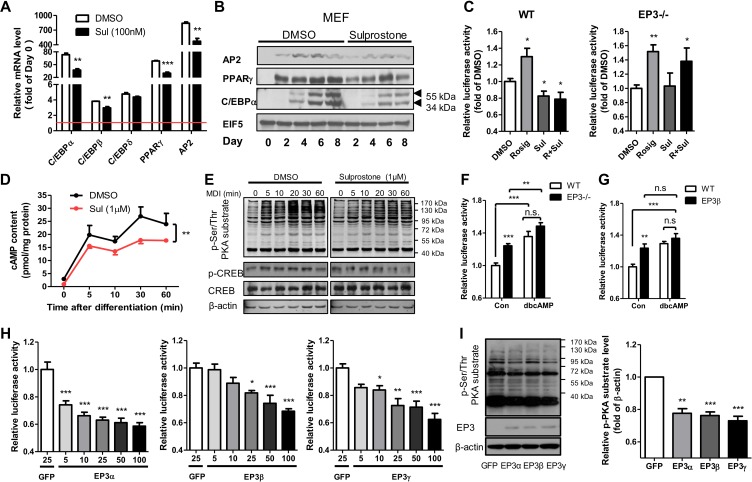
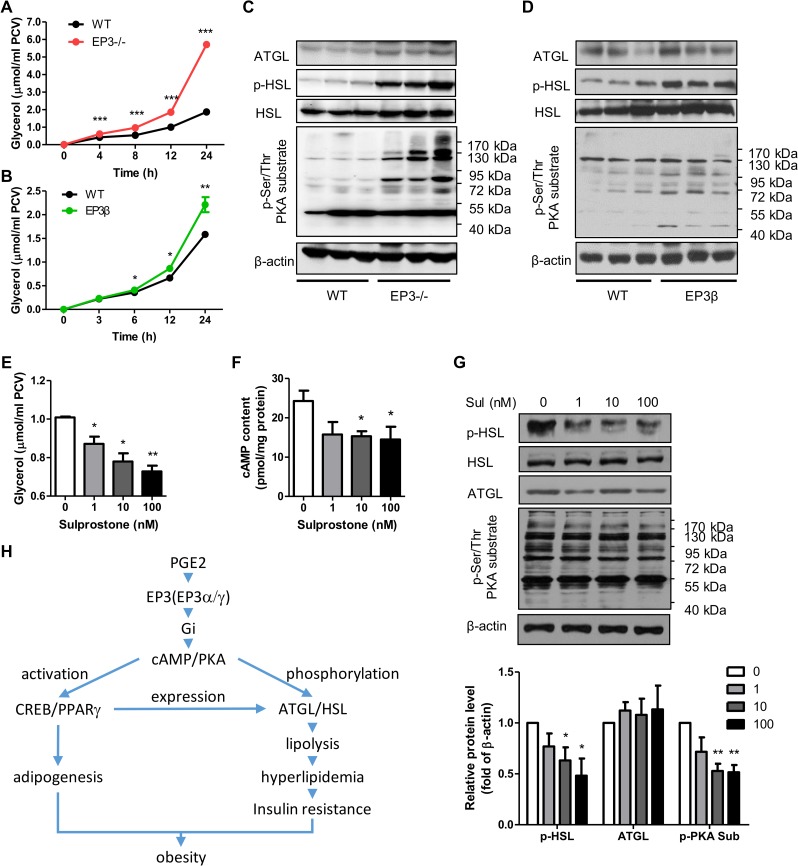
Among the four prostaglandin E2 receptors, EP3 receptor is the one most abundantly expressed in white adipose tissue (WAT). The mouse EP3 gene gives rise to three isoforms, namely EP3α, EP3β, and EP3γ, which differ only at their C-terminal tails. To date, functions of EP3 receptor and its isoforms in WAT remain incompletely characterized. In this study, we found that the expression of all EP3 isoforms were downregulated in WAT of both db/db and high-fat diet-induced obese mice. Genetic ablation of three EP3 receptor isoforms (EP3-/- mice) or EP3α and EP3γ isoforms with EP3β intact (EP3β mice) led to an obese phenotype with increased food intake, decreased motor activity, reduced insulin sensitivity, and elevated serum triglycerides. Since the differentiation of preadipocytes and mouse embryonic fibroblasts to adipocytes was markedly facilitated by either pharmacological blockade or genetic deletion/inhibition of EP3 receptor via the cAMP/PKA/PPARγ pathway, increased adipogenesis may contribute to obesity in EP3-/- and EP3β mice. Moreover, both EP3-/- and EP3β mice had increased lipolysis in WAT mainly due to the activated cAMP/PKA/hormone-sensitive lipase pathway. Taken together, our findings suggest that EP3 receptor and its α and γ isoforms are involved in both adipogenesis and lipolysis and influence food intake, serum lipid levels, and insulin sensitivity.

Keywords: EP3 receptor isoform; PKA; PPARγ; arachidonic acid; insulin resistance; obesity.


Figures

Figure 1
Figure 1
The expression of EP3 receptor in WAT. (A) EP3 expression in various organs and tissues of normal mice. Four male mice and four female mice were used to detect the mRNA levels of total EP3 in 26 organs and tissues by real-time PCR. (B and C) Decreased expression of EP3 receptor in WAT of db/db mice compared with db/m mice. mRNA level was quantified by real-time PCR (B, n = 5 in each group) and protein level was detected by western blot (C, n = 3 in each group). The lower bargraph in C is the quantification of western blot. (D and E) Decreased expression of EP3 receptor in WAT of DIO mice compared with control diet mice. mRNA level was quantified by real-time PCR (D, n = 10 in each group) and protein level was detected by western blot (E, n = 4 in each group). The lower bargraph in E is the quantification of western blot. *P < 0.05, **P < 0.01 vs. db/m mice (B, C) or control diet mice (D, E).
Figure 2
Figure 2
Both EP3−/− and EP3β mice displayed spontaneous obese phenotype. (A) Increased body weight of the EP3 /− and EP3β mice. The body weight of male EP3 /− mice (n = 6), EP3β mice (n = 13), and their WT littermates (n = 34) were measured from 8 to 20 weeks. (B) MRI analysis of the body composition of WT, EP3−/−, and EP3β mice at 20 weeks. The lean mass and fat mass of WT (n = 6), EP3−/− (n = 7), and EP3β (n = 5) mice were analyzed. (C) Morphologic analysis of adipocytes from WAT of WT, EP3−/−, and EP3β mice at 20 weeks. Representative pictures (400×) are shown on the left. The adipocyte size and the frequency of the cell size were calculated and shown on the right. Three sections from different mice per group were randomly selected. (D and E) Less motor activities in the EP3−/− and EP3β mice than in WT mice. Motor activities were measured by the metabolic cage for 24 h lasting one light and dark cycle. Accumulated activities were calculated during light time, dark time, and total time course as shown in inset. n = 12 for WT, n = 12 for EP3−/− mice, and n = 9 for EP3β mice. The mice were measured at the age of 4−6 months. *P < 0.05, **P < 0.01, ***P < 0.001, EP3−/− vs. WT mice; #P < 0.05, ##P < 0.01, ###P < 0.001, EP3β vs. WT mice.
Figure 3
Figure 3
The EP3−/− and EP3β mice exhibited insulin resistance and enhanced VLDL-TG production. (A and B) The EP3−/− mice exhibited insulin resistance at 20 weeks. (A) Hyperinsulinemic-euglycemic clamp test of WT (n = 4) and EP3−/− (n = 3) mice. (B) ITT of WT (n = 15) and EP3−/− (n = 8) mice. (C) The EP3β mice exhibited insulin resistance at 20 weeks. ITT of WT (n = 17) and EP3β (n = 10) mice. (DF) Determination of insulin resistant index in WT, EP3−/−, and EP3β mice. Fasted plasma glucose (D) and insulin (E) of WT (n = 5), EP3−/− (n = 6), and EP3β (n = 5) mice were measured. (F) Insulin resistant index (HOMA-IR) was calculated with fasted plasma glucose concentration and insulin concentration. (G) Increased VLDL-TG production of EP3−/− and EP3β mice at 8 weeks. Serum TG was measured at different time points after intraperitoneal injection of tyloxapol. n = 8 for WT, n = 5 for EP3−/− mice, and n = 4 for EP3β mice. (H) No difference of TG clearance was observed among WT, EP3−/−, and EP3β mice at 8 weeks. Serum TG was measured at different time points after tail vein injection of intralipid. n = 11 for WT, n = 7 for EP3−/− mice, and n = 5 for EP3β mice. AU, arbitrary unit. *P < 0.05, **P < 0.01, ***P < 0.001 vs. WT mice.
Figure 4
Figure 4
EP3 receptor suppressed preadipocyte differentiation. (A) Endogenous PGE2 inhibited MEF differentiation into adipocytes. MEFs were pretreated with 60 μM indomethacin for 1 h before the dexamethasone, IBMX, and insulin (DMI) induction with dexamethasone, insulin, and 3-isobutyl-1-methylxanthine (IBMX). Rosiglitazone was used as a positive control for adipogenesis. (B) Exogenous PGE2 inhibited adipogenesis. Different concentrations of exogenous PGE2 were used to treat WT MEFs before the DMI induction. (C) Effects of activation or blockade of EP3 on MEF differentiation. WT MEFs were pretreated with different concentrations of sulprostone or L-798106 for 1 h before the DMI induction. (D) Enhanced adipogenesis of the EP3−/− MEFs. MEFs from WT and EP3−/− embryos were cultured and differentiated. (E) Increased adipogenesis of the EP3β MEFs. MEFs from WT and EP3β embroys were cultured to differentiate into adipocytes. (F) The effect of each EP3 isoform on adipogenesis. EP3−/− MEFs were cultured and infected with the GFP, EP3α, EP3β, and EP3γ adenoviruses for 2 days before the DMI induction. For all adipogenesis experiments, after 8 days of differentiation, Oil Red O staining was performed, followed by taking images (A and C 200×, DF 400×) or isopropanol dissolution. The absorption of dissolved Oil Red O was read under 570 nm wavelength. *P < 0.05, **P < 0.01, ***P < 0.001 vs. control (A, C) or GFP (F). ###P < 0.001 vs. indomethacin (A). n = 3 for each group.
Figure 5
Figure 5
EP3 suppressed preadipocyte differentiation via the cAMP/PKA/PPARγ pathway. (A) The effect of sulprostone treatment on adipogenic gene expression. Pretreatment of WT MEFs with 100 nM sulprostone inhibited mRNA expression of preadipocyte differentiation markers on Day 4, as quantified by real-time PCR. Each gene was calculated by fold of Day 0 (the red line). (B) The effect of sulprostone treatment on adipogenic protein expression. Pretreatment of WT MEFs with 100 nM sulprostone decreased protein levels of AP2, PPARγ, and C/EBPα on different days. (C) Sulprostone suppressed the activity of PPARγ in WT MEFs. Relative PPRE-driven luciferase activity of WT and EP3−/− MEFs was tested, with 1 µM sulprostone treatment and 1 µM rosiglitazone as positive control. (D and E) Sulprostone inhibited DMI-induced activation of the cAMP/PKA pathway in 3T3-L1 cells. 3T3-L1 preadipocytes were pretreatment with 1 μM sulprostone. The cAMP content was measured by ELISA (D), and the phospho-Ser/Thr PKA substrate and phospho-CREB levels were detected by western blot (E). (F and G) Increased cAMP content in the EP3−/− and EP3β MEFs. Relative luciferase activity of WT and EP3−/− MEFs (F) or EP3β MEFs (G) were tested, with dbcAMP (0.5 mM) as positive control. (H and I) The effect of EP3α, EP3β, and EP3γ adenoviral infection on cAMP contents and PKA activity in EP3−/− MEFs. Relative CRE-driven luciferase activity of MEFs with the overexpression of EP3α, EP3β, and EP3γ, respectively, were tested (H). The phospho-Ser/Thr PKA substrate levels were detected by western blot (I). The right bargraph in I shows the quantification of western blots. For all adipogenesis experiments, after 8 days of differentiation, Oil Red O staining was performed, followed by taking images or isopropanol dissolution. The absorption of dissolved Oil Red O was read under 570 nm wavelength. *P < 0.05, **P < 0.01, ***P < 0.001 vs. DMSO (A, C, D), control (F, G), or GFP (H, I). n = 3−4 in each group.
Figure 6
Figure 6
Increased lipolysis in WAT of the EP3−/− and EP3β mice. (A) Deletion of entire EP3 facilitated lipolysis. The glycerol was released into the medium from primary mature adipocytes of 12-week-old WT (n = 6) and EP3−/− (n = 6) mice at different time points. (B) Genetic ablation of both EP3α and EP3γ isoforms enhanced lipolysis. Primary mature adipocytes from 12-week-old WT (n = 4) and EP3β (n = 4) mice were cultured and the released glycerol was measured at different time points. (C and D) The effect of deletion of entire EP3 or EP3α and EP3γ isoforms on lipase expression and PKA activity. Protein levels of ATGL, HSL, phospho-HSL (Ser660), and phospho-Ser/Thr PKA substrate in the epididymal fat of WT and EP3−/− (C) or EP3β mice (D) were quantified by western blot. (EG) The effect of sulprostone treatment on the cAMP/PKA/HSL pathway in rat primary mature adipocytes. Different concentrations of sulprostone were applied to rat primary mature adipocytes for 12 h. (E) The released glycerol was measured. (F) The cAMP content was determined by ELISA. (G) Protein levels of ATGL, HSL, phospho-HSL (Ser660), and phospho-Ser/Thr PKA substrate were detected by western bolt. The lower bargraph in G is the quantification of western blots. *P < 0.05, **P < 0.01, ***P < 0.001 vs. WT mice (A, B) or control (EG). n = 3−4 in each group unless otherwise clarified. (H) An abridged view of EP3 in WAT and obesity.

Similar articles

Cited by

References

    1. Ahmadian M., Wang Y., and Sul H.S. (2010). Lipolysis in adipocytes. Int. J. Biochem. Cell Biol. 42, 555–559. - PMC - PubMed
    1. Arner P., and Langin D. (2014). Lipolysis in lipid turnover, cancer cachexia, and obesity-induced insulin resistance. Trends Endocrinol. Metab. 25, 255–262. - PubMed
    1. Bastard J.P., Maachi M., Lagathu C., et al. . (2006). Recent advances in the relationship between obesity, inflammation, and insulin resistance. Eur. Cytokine Netw. 17, 4–12. - PubMed
    1. Bays H. (2014). Central obesity as a clinical marker of adiposopathy; increased visceral adiposity as a surrogate marker for global fat dysfunction. Curr. Opin. Endocrinol. Diabetes Obes. 21, 345–351. - PMC - PubMed
    1. Borglum J.D., Pedersen S.B., Ailhaud G., et al. . (1999). Differential expression of prostaglandin receptor mRNAs during adipose cell differentiation. Prostaglandins Other Lipid Mediat. 57, 305–317. - PubMed

Publication types

MeSH terms

Substances