. 2016 Jul 20:6:30072.
doi: 10.1038/srep30072.

Impaired neuronal KCC2 function by biallelic SLC12A5 mutations in migrating focal seizures and severe developmental delay

Affiliations

Impaired neuronal KCC2 function by biallelic SLC12A5 mutations in migrating focal seizures and severe developmental delay

Hirotomo Saitsu et al. Sci Rep. .

Abstract

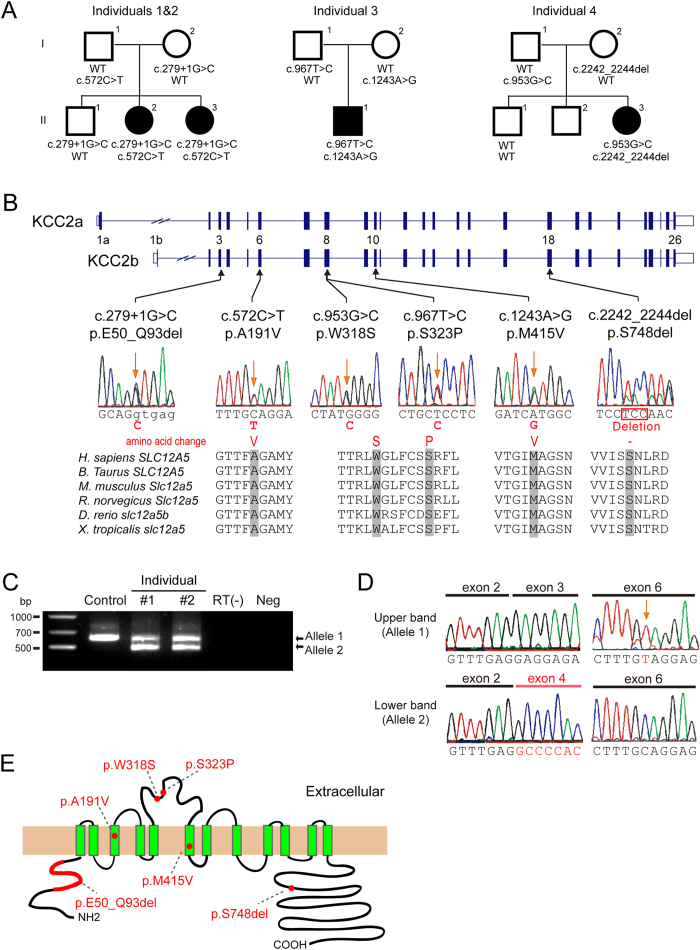
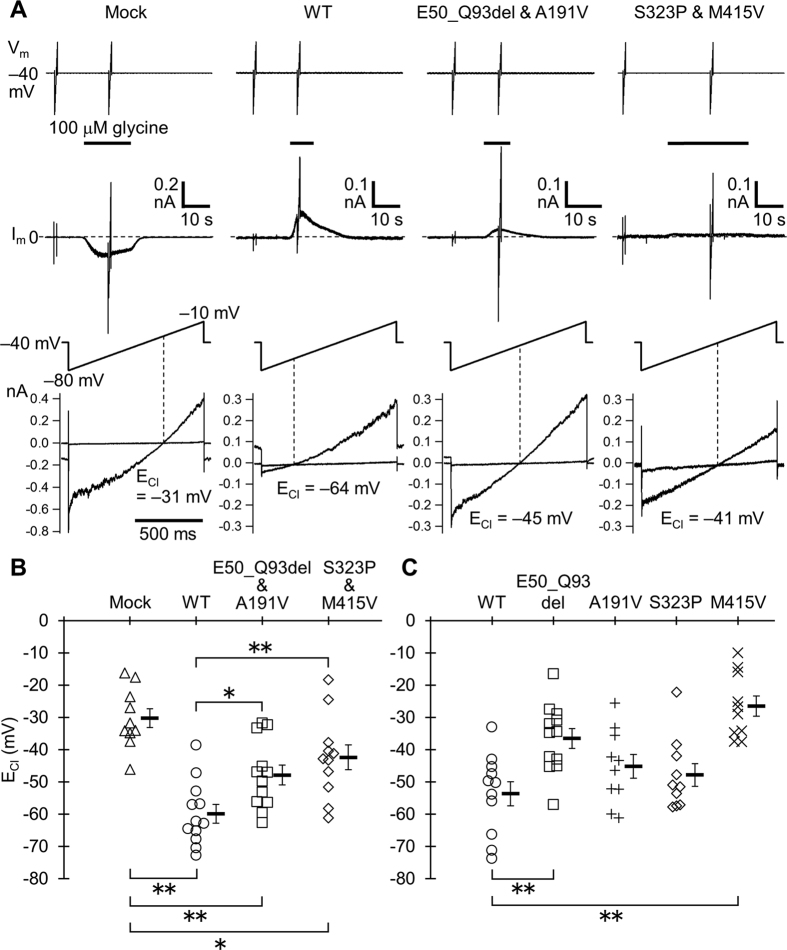
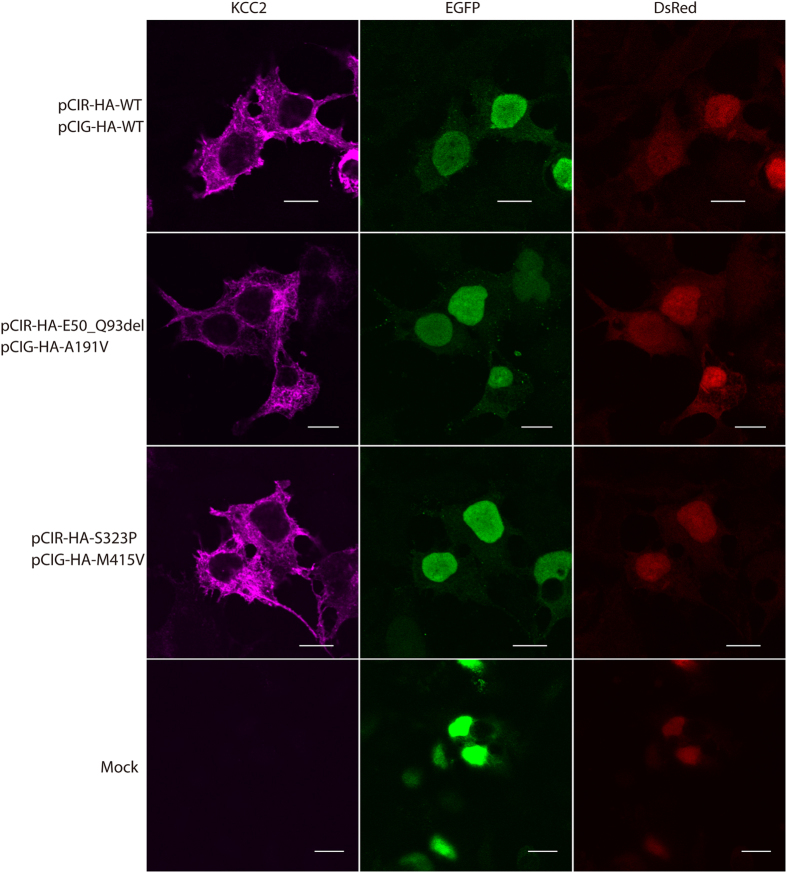
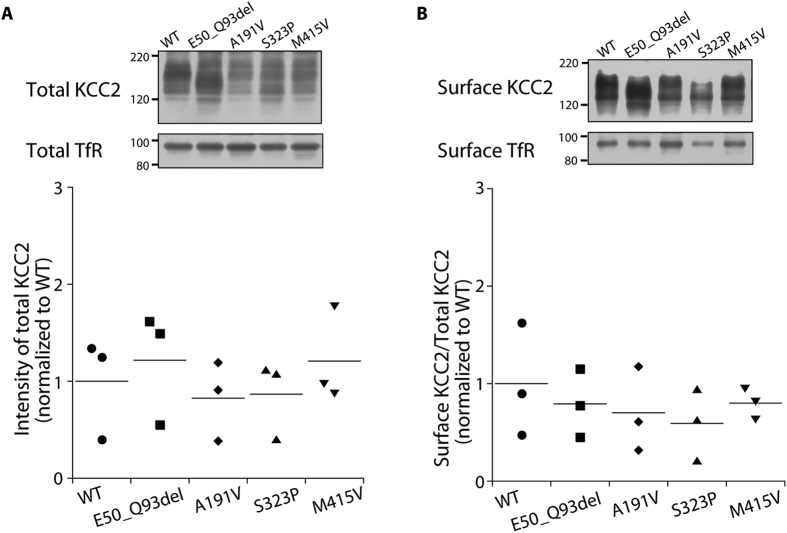
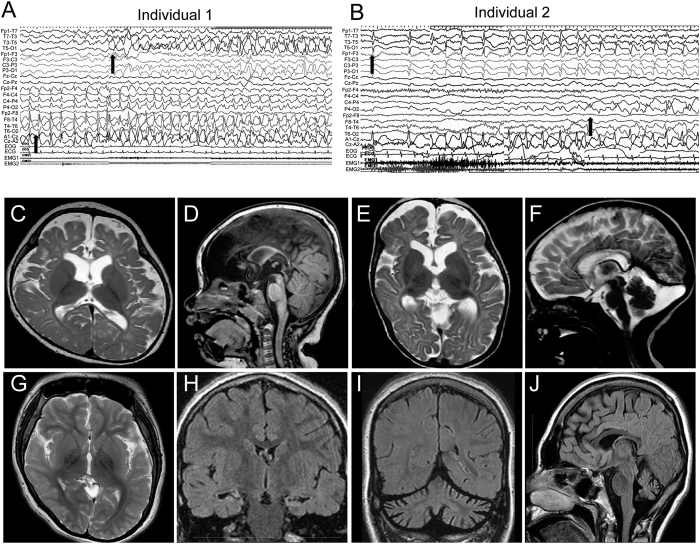
Epilepsy of infancy with migrating focal seizures (EIMFS) is one of the early-onset epileptic syndromes characterized by migrating polymorphous focal seizures. Whole exome sequencing (WES) in ten sporadic and one familial case of EIMFS revealed compound heterozygous SLC12A5 (encoding the neuronal K(+)-Cl(-) co-transporter KCC2) mutations in two families: c.279 + 1G > C causing skipping of exon 3 in the transcript (p.E50_Q93del) and c.572 C >T (p.A191V) in individuals 1 and 2, and c.967T > C (p.S323P) and c.1243 A > G (p.M415V) in individual 3. Another patient (individual 4) with migrating multifocal seizures and compound heterozygous mutations [c.953G > C (p.W318S) and c.2242_2244del (p.S748del)] was identified by searching WES data from 526 patients and SLC12A5-targeted resequencing data from 141 patients with infantile epilepsy. Gramicidin-perforated patch-clamp analysis demonstrated strongly suppressed Cl(-) extrusion function of E50_Q93del and M415V mutants, with mildly impaired function of A191V and S323P mutants. Cell surface expression levels of these KCC2 mutants were similar to wildtype KCC2. Heterologous expression of two KCC2 mutants, mimicking the patient status, produced a significantly greater intracellular Cl(-) level than with wildtype KCC2, but less than without KCC2. These data clearly demonstrated that partially disrupted neuronal Cl(-) extrusion, mediated by two types of differentially impaired KCC2 mutant in an individual, causes EIMFS.


Figures

Figure 1
Figure 1. Biallelic SLC12A5 mutations.
(A) Familial pedigrees of four individuals with SLC12A5 mutations. The segregation of each mutation is shown. (B) Schematic representation of SLC12A5 (open and filled rectangles represent untranslated regions and coding regions, respectively) and its mutations. There are two transcriptional variants: variant 1 (GenBank accession number, NM_001134771.1) encoding KCC2a, variant 2 (NM_020708.4) encoding KCC2b. All missense mutations and an amino acid deletion (p.S748del) occur at evolutionarily conserved amino acids. Homologous sequences were aligned by the CLUSTALW website. (C) Reverse transcriptase-PCR analysis of individuals 1 and 2, and a control. Two PCR products representing transcripts from two alleles were detected in the individual cDNA, but only a single amplicon was detected in the control. (D) Sequence of upper (allele 1) and lower (allele 2) amplicons clearly show a c.572C > T mutation at exon 6 in allele 1 and deletion of exon 3 in allele 2. (E) Schematic presentation of the KCC2 protein. Localization of the six mutations (red circle and bold lines) is shown.
Figure 2
Figure 2. ECl in WT and mutant KCC2-expressing HEK293-GlyRα1 cells.
(A) Representative traces of GlyR currents in cells co-transfected with two different vectors encoding only EGFP and DsRed (Mock), WT-KCC2 (WT), two KCC2 mutants expressed in individuals 1 and 2 (E50_Q93del & A191V), and mutants in individual 3 (S323P & M415V). Currents were recorded under the gramicidin-perforated voltage-clamp condition. Upper traces indicate membrane voltage (Vm) changes. The holding voltage was −40 mV. Two 1-s voltage ramps from −80 to −10 mV were applied before and during bath application of 100 μM glycine. Middle traces show membrane current (Im) responses. The humps of GlyR currents were generated during glycine application at the holding voltage of −40 mV, and the current responses to voltage ramps were generated before and during the humps. Note that the current levels immediately before and after a ramp response during a GlyR current hump were almost unchanged, and therefore the time course of the humps was not affected by ramp responses. This confirmed that the net Cl flux across the cell membrane during a ramp response did not significantly alter ECl. See also Supplementary Fig. S1. Bottom traces are the expanded traces of single voltage ramps (upper traces) and superimposed current responses to voltage ramps before and during glycine application (lower traces). Dotted lines indicate the voltage levels at which the superimposed current traces intersected, corresponding to ECl. (B) Plot of ECl in cell groups of Mock (n = 10), WT (n = 12), E50_Q93del & A191V (n = 12), and S323P & M415V (n = 11). *P < 0.03, **P < 0.01 by REGW F-test. (C) Plot of ECl in cells transfected with single vectors encoding WT (n = 11), E50_Q93del (n = 12), A191V (n = 10), S323P (n = 10), and M415V (n = 10). **P < 0.01 by Dunnett’s two-sided t-test.
Figure 3
Figure 3. Cellular distribution of KCC2 mutants in transfected HEK293 cells.
Confocal immunofluorescence images of KCC2 in HEK293 cells co-expressing pCIR-HA-WT and pCIG-HA-WT (uppermost row), pCIR-HA-E50_Q93del and pCIG-HA-A191V (2nd row), pCIR-HA-S328P and pCIG-HA-M415V (3rd row), and only pCIG-HA and pCIR-HA (Mock; lowermost row). Cotransfection of HEK293 cells was confirmed by the presence of EGFP (green) and DsRed (red) in the nucleus. Similar expression patterns of KCC2 (pink) were observed in WT- and mutant-expressing cells. KCC2 immunofluorescence was not observed in mock-transfected cells. Scale bars represent 10 μm.
Figure 4
Figure 4. Cell surface and total expression levels of KCC2 mutants, as measured by the surface biotinylation and immunoblotting assay of KCC2 and transferrin receptor (TfR).
(A) Upper panels show representative immunoblots of total KCC2 and total TfR. In the dot plot, the total KCC2 levels were normalized to total TfR levels in each type of transfected cell. There were no significant differences in mean total KCC2 level between WT- and mutant-expressing cells (P = 0.7835, n = 3). (B) Upper panels show representative immunoblots of surface KCC2 and surface TfR. The dot plot shows the ratios of surface KCC2 levels to total KCC2 levels in each type of transfected cell, which were further normalized to the mean ratio in WT-expressing cells. There are no significant differences in the normalized ratio between WT- and mutant-expressing cells (P = 0.7899, n = 3).
Figure 5
Figure 5. Clinical features of individuals with biallelic SLC12A5 mutations.
(A) Ictal EEG of individual 1. The initial spikes over the right frontal area (lower arrow) were accompanied by eye deviation to the left, then the left temporal spikes emerged (upper arrow) with subsidence of the right frontal spikes, which were accompanied by eye deviation to the right. (B) Ictal EEG of individual 2. The initial spikes over the left temporal area (upper arrow) were accompanied by a tonic seizure of the right upper extremity, then the right parietal spikes emerged (lower arrow) with subsidence of the left temporal spikes, which was accompanied by a tonic seizure of the left upper extremity. (C–J) Brain MRI of individual 1 at 13 months of age (C,D), individual 2 at 5 months (E,F), and individual 4 at 20 years of age (G–J). T2-weighted images (C,E–G) and T1-weighted images (D,J) and fluid-attenuated inversion recovery images (FLAIR) (H and I) are shown. Thin corpus callosum, frontal and temporal lobe atrophy, and delayed myelination were commonly observed in individuals 1 and 2 (C–F). Arachnoid cyst in the left posterior fossa was observed in individual 2 (F). Delayed myelination in the subcortical white matter of the temporal lobe was observed in individual 4 (G). Inferior horns of the lateral ventricle were mildly dilated and bilateral hippocampi were hypoplastic with slightly high signal intensity on FLAIR coronal view (H), indicating hippocampal sclerosis. Atrophic change of the cerebellar hemisphere (I) and vermis (J) was evident.

Similar articles

Cited by

References

    1. McTague A. et al.. Migrating partial seizures of infancy: expansion of the electroclinical, radiological and pathological disease spectrum. Brain 136, 1578–91 (2013). - PMC - PubMed
    1. Barcia G. et al.. De novo gain-of-function KCNT1 channel mutations cause malignant migrating partial seizures of infancy. Nat Genet 44, 1255–9 (2012). - PMC - PubMed
    1. Poduri A. et al.. SLC25A22 is a novel gene for migrating partial seizures in infancy. Ann Neurol 74, 873–82 (2013). - PMC - PubMed
    1. Poduri A. et al.. Homozygous PLCB1 deletion associated with malignant migrating partial seizures in infancy. Epilepsia 53, e146–50 (2012). - PMC - PubMed
    1. Carranza Rojo D. et al.. De novo SCN1A mutations in migrating partial seizures of infancy. Neurology 77, 380–3 (2011). - PMC - PubMed

Publication types