. 2016 Sep;172(1):38-61.
doi: 10.1104/pp.16.00354. Epub 2016 Jul 19.

Indel Group in Genomes (IGG) Molecular Genetic Markers

Affiliations

Indel Group in Genomes (IGG) Molecular Genetic Markers

Ted W Toal et al. Plant Physiol. 2016 Sep.

Abstract

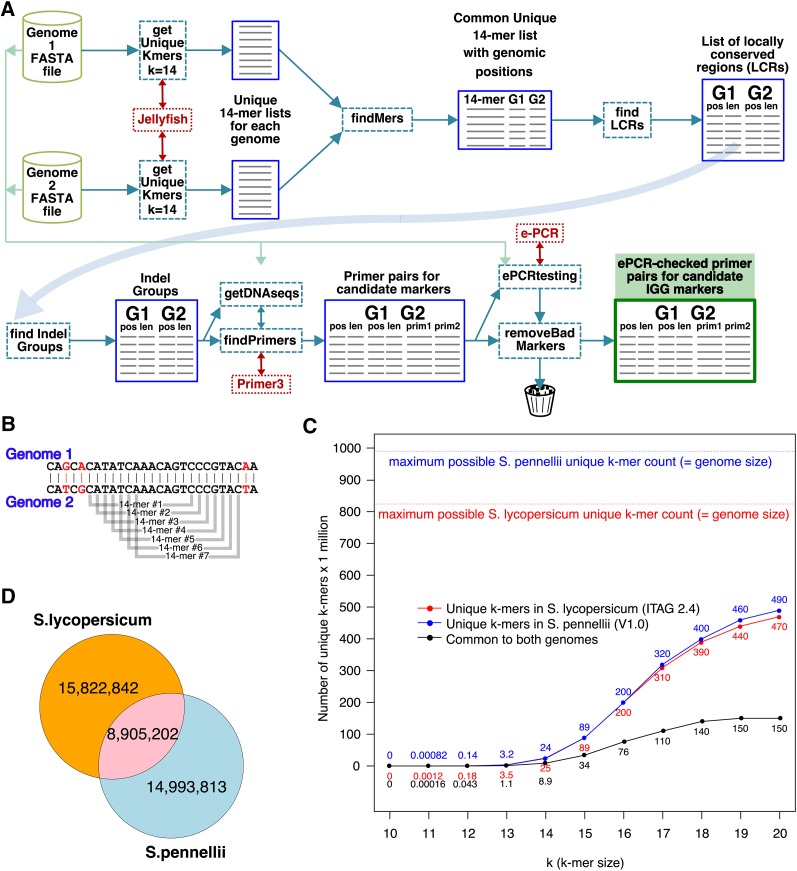
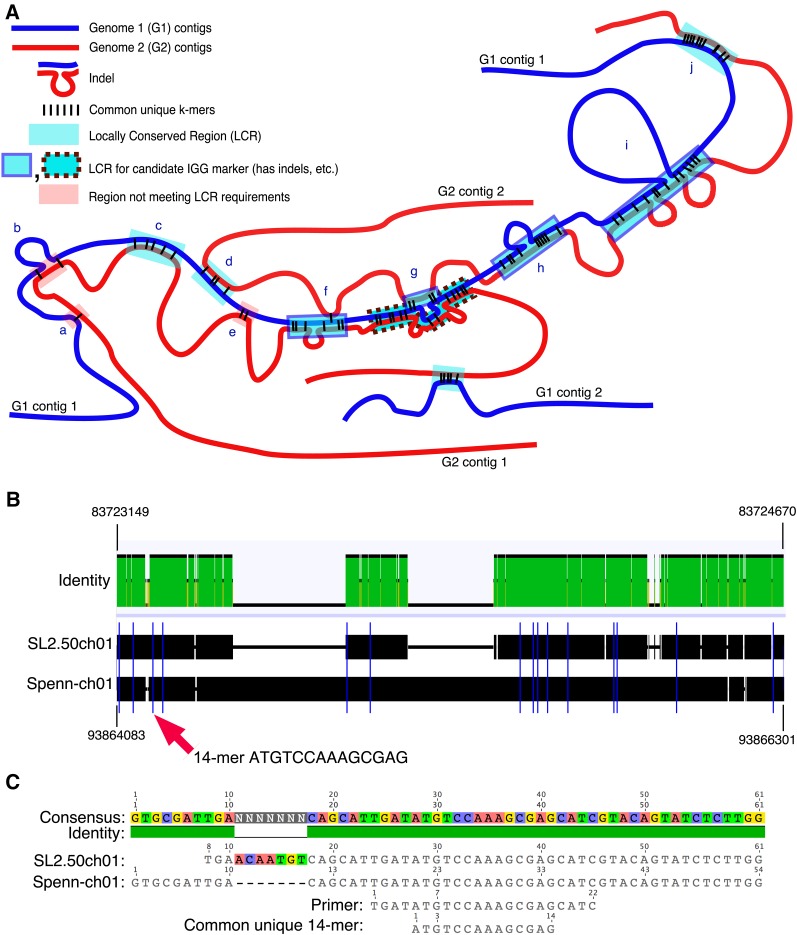
Genetic markers are essential when developing or working with genetically variable populations. Indel Group in Genomes (IGG) markers are primer pairs that amplify single-locus sequences that differ in size for two or more alleles. They are attractive for their ease of use for rapid genotyping and their codominant nature. Here, we describe a heuristic algorithm that uses a k-mer-based approach to search two or more genome sequences to locate polymorphic regions suitable for designing candidate IGG marker primers. As input to the IGG pipeline software, the user provides genome sequences and the desired amplicon sizes and size differences. Primer sequences flanking polymorphic insertions/deletions are produced as output. IGG marker files for three sets of genomes, Solanum lycopersicum/Solanum pennellii, Arabidopsis (Arabidopsis thaliana) Columbia-0/Landsberg erecta-0 accessions, and S. lycopersicum/S. pennellii/Solanum tuberosum (three-way polymorphic) are included.


Figures

Figure 1.
Figure 1.
A, IGGPIPE, an IGG marker-finder software pipeline. Two genome sequences (G1 and G2) are analyzed for common unique k-mers that identify locally conserved regions (LCRs), some of which are polymorphic for length, containing one or more indels between flanking conserved sequences, making them Indel Groups. Primers are designed in the flanking conserved regions and verified with e-PCR to produce candidate IGG markers. Pipeline software is shown in dashed boxes and data in solid boxes. B, A new k-mer starts at each base position. Shown here are seven consecutive 14-mers common to two genomes. C, Number of unique k-mers in S. lycopersicum and closely related S. pennellii as a function of k, and number of unique k-mers common to both species. As k increases, the number of unique k-mers increases, gradually approaching the genome size limit. The common unique k-mer count does not keep increasing, but at some value of k it will reach a peak, here around k = 19 or k = 20. D, With k = 14, S. lycopersicum and S. pennellii have almost 9 million unique k-mers in common between them.
Figure 2.
Figure 2.
A, LCRs are regions of paired contigs within the genomes under consideration (here G1 and G2) having a sufficient number and spacing of unique k-mers in common between the contigs. When indels are present within LCRs, they form the basis for creating candidate IGG markers. Common unique k-mers can connect pairs of contigs in many ways. The parameter DMAX is the maximum spacing between two adjacent k-mers of the same LCR, and k-mers farther apart than that are assigned to different LCRs. If the number of k-mers is less than parameter KMIN (here assumed to be 4), the k-mers are assumed to be random common unique k-mers not signifying a conserved region, and no LCR is called for that region (a, b, and e). LCRs may have no indels in them (c, d, and j) or there may be a single indel (b, f, and h) or more than one (i). Different LCRs along a contig of one genome might include different contigs in the other genome (a, b, c, and e versus d). Some LCRs may have one or more random interspersed k-mers connecting a contig pair that is different from the contig pair of the LCR (f). Some regions may have complex overlapping of more than one LCR (g). B, Alignment of S. lycopersicum and S. pennellii genomes in the region of an LCR on chromosome 1. Blue vertical lines are positions of common unique 14-mers. An indel is visible that might provide sufficient length polymorphism for an IGG marker surrounding this area. The red arrow points to one 14-mer whose region is enlarged below. C, Enlargement of the region around the third 14-mer in B, showing a multiple alignment of the S. lycopersicum and S. pennellii genome sequences in this region, the primer generated by IGGPIPE, and the 14-mer itself. Alignments were made with Geneious (Kearse et al., 2012).
Figure 3.
Figure 3.
Characteristics of indels found within Indel Groups, from an IGGPIPE analysis of S. lycopersicum SL2.50/ITAG2.4/S. pennellii V2.0 (k = 14, AMIN = 100, AMAX = 3,000, and ADMIN = ADMAX = 100; A and C) and Arabidopsis accessions Col-0/Ler-0 (k = 13, other parameters are the same; B and D). A and B, Each Indel Group was plotted as a point, where the x axis is the predicted amplicon size difference and the y axis is the number of indels found in the Indel Group after aligning the two sequences. C and D, Similar plot but the y axis is indel size. The 45° line represents Indel Groups containing a single indel that is responsible for the amplicon size difference. Some points lie above the line because a single Indel Group can have deletions in both genomes at different places.
Figure 4.
Figure 4.
Additional characteristics of indels found within Indel Groups, from the same analysis cited in Figure 3. A and C, S. lycopersicum SL2.50/ITAG2.4/S. pennellii V2.0. B and D, Arabidopsis accessions Col-0/Ler-0. A and B, The number of indels of different sizes decreases approximately exponentially as the indel length increases. C and D, Density of Indel Group indels within genomic features found in the LCRs containing the Indel Groups. Upstream is defined as within 1,000 bp 5′ of the 5′ UTR, and downstream is within 1,000 bp 3′ of the 3′ UTR of a gene, while intergenic is any position not falling into any of the other categories. CDS, Coding sequence.
Figure 5.
Figure 5.
A and B, Distribution of differences in IGG marker amplicon sizes between the two analyzed genomes, from an IGGPIPE analysis of S. lycopersicum SL2.50/ITAG2.4/S. pennellii V2.0 (k = 14, AMIN = 400, AMAX = 1,500, ADMIN = 50, and ADMAX = 300; A) and Arabidopsis accessions Col-0/Ler-0 (k = 13, other parameters are the same; B). A positive difference means that the S. lycopersicum or Col-0 amplicon is the larger, and a negative difference means that the S. pennellii or Ler-0 amplicon is the larger. C and D, Density of IGG markers (top graphs) and genes (bottom graphs) along a representative chromosome, from the same analysis as above. C, Chromosome 1 of S. lycopersicum. Note the positive correlation. D, Chromosome 2 of Arabidopsis Col-0 accession.
Figure 6.
Figure 6.
Twenty-four IGG markers, two per chromosome at locations within the first or last 15% of each chromosome, were chosen randomly from three different IGGPIPE runs using different sets of parameters and all analyzing the S. lycopersicum (SL2.50/ITAG2.4 pseudomolecules) and S. pennellii (V2.0 pseudomolecules) genomes. In 21 of the 24 markers (87.5%) amplifying S. lycopersicum cv M82, S. pennellii (PEN), and F1 DNA, two bands of the expected amplicon sizes are seen (Table IV), one in each species. In two cases, no band is seen in either species, and in another case, only an S. lycopersicum band is seen.
Figure 7.
Figure 7.
Gel electrophoresis of PCR products of several candidate IGG markers from two IGGPIPE runs. A, Testing primers generated against Arabidopsis accessions Ler-0 and Col-0. PCR product was resolved on 2% gels. M, BioLabs QuickLoad 100-bp ladder; C, Col-0; LC, Ler-0/Col-0 hybrid; and L, Ler-0. Eight of 10 show expected product sizes (Table VII). B to D, PCR products by gel electrophoresis using IGG markers from a triallelic marker run with S. lycopersicum, S. pennellii, and S. tuberosum genomes. M, O’GeneRuler 1Kb Plus ladder; L, S. lycopersicum; P, S. pennellii; S, S. sitiens; and T, S. tuberosum. B, IGG marker B_9447 shows three-way polymorphism between the three genomes of interest, and amplicons are of predicted size (Table IX). In addition, S. tuberosum and S. sitiens share the same allele. C, Marker B_5427 also shows three-way polymorphism between the three genomes of interest. In this case, the S. tuberosum amplicon is closer to 700 bp than the predicted 527 bp. S. lycopersicum and S. pennellii have predicted amplicon sizes. In addition, S. tuberosum and S. sitiens have a very small or zero size difference. D, Markers B_24108, B_25784, and B_26991 also indicate three-way polymorphism between S. lycopersicum, S. pennellii, and S. tuberosum. However, S. sitiens shares an allele with either S. pennellii (B_24108) or S. lycopersicum (B_26991). The presence of multiple bands is observed for select genotypes.

Similar articles

Cited by

References

    1. Ahmed A, Ferreira AS, Hartskeerl RA (2015) Multilocus sequence typing (MLST): markers for the traceability of pathogenic Leptospira strains. Methods Mol Biol 1247: 349–359 - PubMed
    1. Bolger A, Scossa F, Bolger ME, Lanz C, Maumus F, Tohge T, Quesneville H, Alseekh S, Sørensen I, Lichtenstein G, et al. (2014) The genome of the stress-tolerant wild tomato species Solanum pennellii. Nat Genet 46: 1034–1038 - PMC - PubMed
    1. Bombarely A, Menda N, Tecle IY, Buels RM, Strickler S, Fischer-York T, Pujar A, Leto J, Gosselin J, Mueller LA (2011) The Sol Genomics Network (solgenomics.net): growing tomatoes using Perl. Nucleic Acids Res 39: D1149–D1155 - PMC - PubMed
    1. Borevitz JO, Liang D, Plouffe D, Chang HS, Zhu T, Weigel D, Berry CC, Winzeler E, Chory J (2003) Large-scale identification of single-feature polymorphisms in complex genomes. Genome Res 13: 513–523 - PMC - PubMed
    1. Botstein D, White RL, Skolnick M, Davis RW (1980) Construction of a genetic linkage map in man using restriction fragment length polymorphisms. Am J Hum Genet 32: 314–331 - PMC - PubMed

Publication types

Substances