

Codon identity regulates mRNA stability and translation efficiency during the maternal-to-zygotic transition
- PMID: 27436874
- PMCID: PMC5048347
- DOI: 10.15252/embj.201694699
Codon identity regulates mRNA stability and translation efficiency during the maternal-to-zygotic transition
Abstract
Cellular transitions require dramatic changes in gene expression that are supported by regulated mRNA decay and new transcription. The maternal-to-zygotic transition is a conserved developmental progression during which thousands of maternal mRNAs are cleared by post-transcriptional mechanisms. Although some maternal mRNAs are targeted for degradation by microRNAs, this pathway does not fully explain mRNA clearance. We investigated how codon identity and translation affect mRNA stability during development and homeostasis. We show that the codon triplet contains translation-dependent regulatory information that influences transcript decay. Codon composition shapes maternal mRNA clearance during the maternal-to-zygotic transition in zebrafish, Xenopus, mouse, and Drosophila, and gene expression during homeostasis across human tissues. Some synonymous codons show consistent stabilizing or destabilizing effects, suggesting that amino acid composition influences mRNA stability. Codon composition affects both polyadenylation status and translation efficiency. Thus, the ribosome interprets two codes within the mRNA: the genetic code which specifies the amino acid sequence and a conserved "codon optimality code" that shapes mRNA stability and translation efficiency across vertebrates.
Keywords: codon optimality; decay; maternal‐to‐zygotic transition; translation; zebrafish.
© 2016 The Authors.
Figures
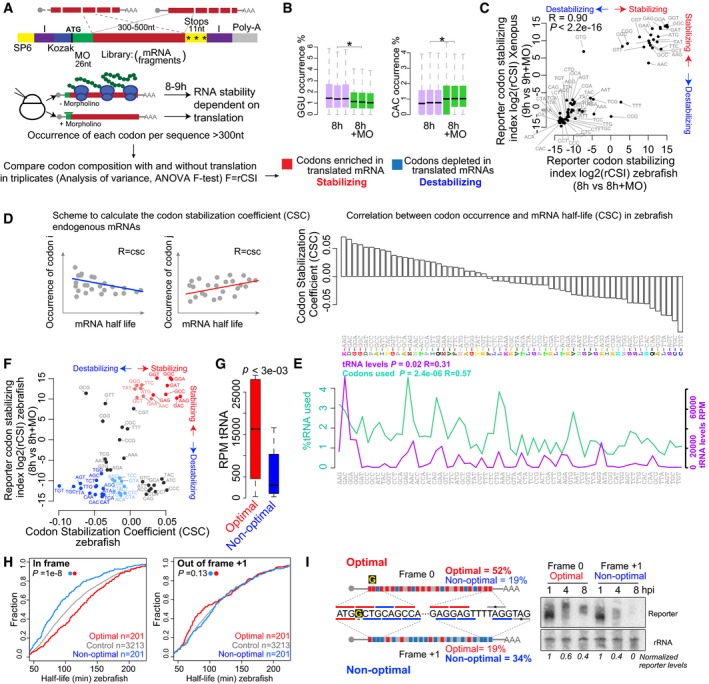
Scheme of the reporter library which includes random fragments of the transcriptome in the CDS. Transcripts share the same 5′ and 3′UTR and 26 nt within the translation start site, which are recognized by a specific translation blocking morpholino (MO) (green). I, Illumina adapters, purple. SP6, SP6 promoter. mRNAs are injected at the one‐cell stage in zebrafish and Xenopus, with or without a translation blocking morpholino. Reporter mRNA library is analyzed 8–9 h post‐injection using high‐throughput sequencing. The analysis of variance (ANOVA) for the occurrence of each codon in the presence (−MO) or the absence (+MO) of translation is performed between triplicates in zebrafish and Xenopus to calculate the reporter codon stabilizing index (rCSI). If codons cause differential mRNA stability in a translation‐dependent manner, potential stabilizing codons should be enriched in translated mRNAs (−MO versus +MO) (+rCSI), and destabilizing codons depleted (−MO versus +MO) (−rCSI).
Box plots showing the occurrence of the GGU and the CAC codons in the presence (+MO) and absence of MO in the reporter mRNA library 8 h post‐injection (hpi) (triplicates). The box defines the first and third quartiles, with the median indicated with a thick black line and vertical lines indicate the variability outside the upper and lower quartiles. *P < 1e‐100, one‐way ANOVA.
Biplots of the reporter codon stabilizing index (rCSI) in the presence and the absence of translation (+MO) in zebrafish and in Xenopus embryos, P < 2.2e‐16, R = 0.9, Spearman rank correlation. The rCSI is the ANOVA F‐test value for the comparison of codon occurrences (e.g. panel B) between treatments in triplicates. This value is multiplied by −1 for depleted/destabilizing codons.
Scheme of the codon stabilization coefficient (CSC) calculated as the Pearson correlation coefficient between the occurrence of each codon and the half‐life of each mRNA. Bar plots ranking the 61 coding codons based on their codon stability coefficient (CSC). The encoded amino acids are indicated.
Line plots of the relative demand of each codon in the zebrafish transcriptome at 6 hpf (% used), and the RNA levels for each tRNA (RPM). The P‐value indicates the significant correlation with the CSC.
Biplots of the rCSI comparing 8 h versus 8 h + MO and CSC in zebrafish embryos, P < 1.2e‐4, R = 0.4, Spearman rank correlation. Based on the consistent identification by both methods, we defined optimal codons highlighted in red and non‐optimal codons in blue. The intensity of the color represents the strength (light, weak; dark, strong) based on different CSC values.
Box plot of tRNA levels (RPM) for optimal and non‐optimal codons (P = 3e‐03, Wilcoxon rank‐sum test). The box defines the first and third quartiles, with the median indicated with a thick black line and vertical lines indicate the variability outside the upper and lower quartiles.
Cumulative distributions of the half‐life of the maternal mRNAs in the absence of zygotic transcription in zebrafish. Shown are all mRNAs (gray), mRNAs with the highest fraction (top quartile) of optimal codons and the lowest fraction of non‐optimal codons (red), mRNAs with the highest fraction of non‐optimal codons and the lowest fraction of optimal codons (blue), in frame (left), or 1 nucleotide out of frame +1 (right) (P = 1e‐8, in frame; P = 0.13, 1 nt out of frame, Wilcoxon rank‐sum test).
Diagram of two transcripts that only differ in a single nucleotide (G in yellow) which creates a frameshift, making one transcript enriched in optimal codons and the other in non‐optimal codons. Time‐course Northern blot shows that non‐optimal transcripts decay faster than their optimal counterparts. The radioactive intensity is shown in italics and normalized to the 1 hpi sample for each injection.
- A
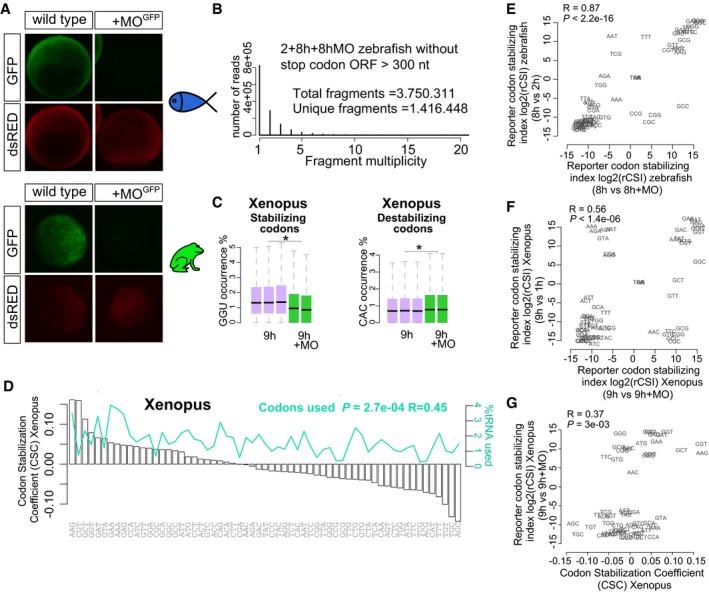
GFP reporter expression (green) and control dsRed expression (red) at 8 hpf and 9.5 hpf in zebrafish and Xenopus, respectively. The GFP reporter is repressed by co‐injection with the morpholino which recognizes the GFP translation initiation sequence (MO). dsRed is not recognized by the MO. This morpholino is complementary to the translation initiation site in the reporter mRNA library used in Fig 1A.
- B
Bar plot shows distribution of fragment multiplicity for fragments longer that 300 nt without stop codons at 2, 8 h, and 8 h + MO in zebrafish embryos, showing a high degree of complexity of the reporter library mRNA.
- C
Box plots show the occurrence of the optimal codon GGU and non‐optimal codon CAC in injected mRNA at 1, 9 h, and 9 h + MO in Xenopus embryos (*P < 1e‐300 and *P < 1e‐300, respectively, one‐way ANOVA). The box defines the first and third quartiles, with the median indicated with a thick black line and vertical lines indicate the variability outside the upper and lower quartiles. The analysis of variance (ANOVA) for the occurrence of each codon in the presence (−MO) or the absence (+MO) of translation is used to calculate the reporter codon stabilizing index (rCSI). If codons cause differential mRNA stability in a translation‐dependent manner, potential stabilizing codons should be enriched in translated mRNAs (−MO versus +MO) (+rCSI), and destabilizing codons depleted (−MO versus +MO) (−rCSI).
- D
Bar plots ranking the 61 coding codons from highest to lowest correlation with mRNA half‐life (CSC). The relative abundance of each codon present in the expressed transcriptome at 9 hpf in Xenopus is shown (green).
- E, F
Biplots of the rCSI derived by comparing codon enrichment or depletion in two different conditions: x‐axis, in the presence and the absence of translation (±MO); y‐axis, in a late versus earlier time points (E) in zebrafish or (F) in Xenopus. Both comparisons yield similar results, ruling out nonspecific effects of the MO. One hour or 2 h is too early to observe the full effects of translational regulation in mRNA stability.
- G
Biplots of the rCSI (9 h/9 h + MO) from Xenopus embryos and the codon stabilization coefficient (CSC) in Xenopus for each codon, P = 3e‐3, R = 0.37, Spearman rank correlation.
- A
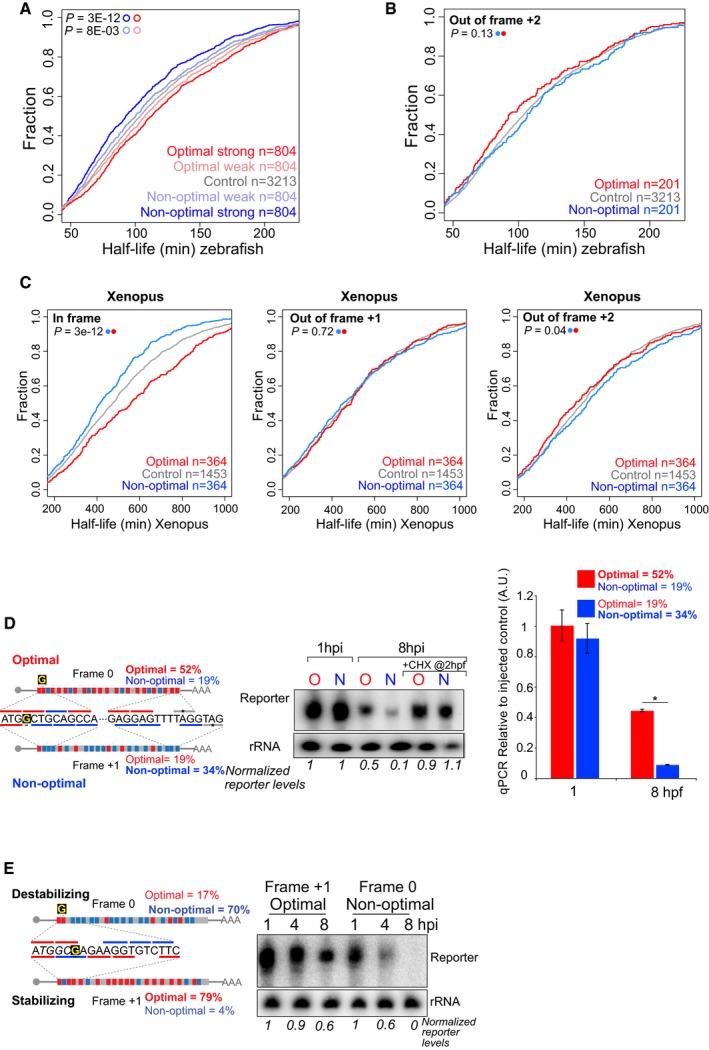
Cumulative distributions of the half‐life of the maternal mRNAs in the absence of zygotic transcription in zebrafish. Represented are mRNAs with the highest fraction of strong optimal codons (red, CSC value > 0.03), weak optimal codons (light red, 0.03 > CSC > 0), weak non‐optimal (light blue −0.03 < CSC < 0), or strong non‐optimal (blue CSC < −0.03). These four groups are non‐overlapping. The control group contains all the maternal transcripts (gray) for which we could calculate the half‐life. This result shows that the effects of the codon optimality (half‐life depending in the codon composition) are gradual and depend on the strength of the codons.
- B
Cumulative distributions of the half‐life of the maternal mRNAs in the absence of zygotic transcription in zebrafish. The red line represents genes enriched in optimal codons quantified 2 nucleotides out frame. The blue one is enriched non‐optimal codons also counting in 2 nucleotides out frame. The gray lines represented all mRNAs. This result shows that the effect of codon optimality depends on the reading frame those codons are analyzed and as such depends on translation rather than a sequence motif independent of the reading frame. The P‐values are shown, and the color code determines the conditions that were compared using a Wilcoxon rank‐sum test.
- C
Cumulative plots shown as described in (B), for Xenopus embryos, counting the codons in frame (left panel), 1 nucleotide out frame (middle) and 2 nucleotides out frame (right panel). These results indicate codon optimality shapes mRNA half‐life in a codon‐dependent manner in Xenopus embryos. The group of transcripts enriched in either optimal or non‐optimal in each of the three frames is different, meaning that the 364 optimal transcripts in frame are different from the 364 enriched in optimal codons when the codons composition was calculated in 1 or 2 nucleotides out of frame.
- D, E
Diagram of two transcripts that only differ in a single nucleotide (G in yellow) which creates a frameshift. One is enriched in optimal codons and the other in non‐optimal codons due to a change in the reading frame. A time‐course Northern blot shows that non‐optimal (N) transcripts decay faster than their optimal (O) counterparts. These differences are lost when translation is blocked by cycloheximide (CHX) (D). The radioactive intensity is shown in italics and normalized to the 1 hpi sample for each injection. Right, qRT–PCR for the two exogenous transcripts with opposite optimality from Fig 1I. Non‐optimal transcripts decay faster than their optimal counterparts (GFP was used as internal control). Results are shown as the averages ± standard error of the mean for three replicates. *P < 0.0001.
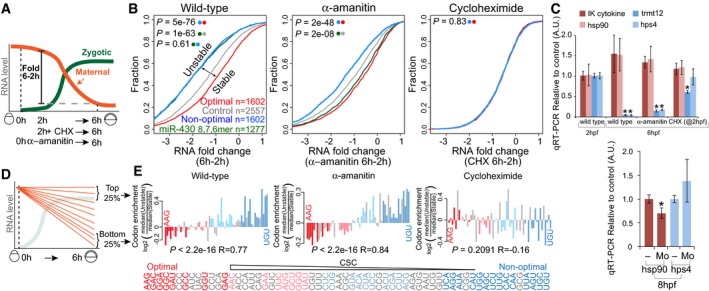
Diagram illustrating the maternal‐to‐zygotic transition in zebrafish, depicting the analysis of mRNA fold changes between 2 and 6 hpf. Embryos were bathed in cycloheximide (CHX) at 2 hpf or injected with the RNA Pol II inhibitor α‐amanitin at 0 hpf.
Cumulative distributions of mRNA fold change (6–2 h) in wild‐type embryos, embryos injected with α‐amanitin, and embryos treated with the translation elongation inhibitor cycloheximide. The different curves represent transcripts: enriched in non‐optimal codons (top quartile, blue), containing at least one miR‐430 complementary site (6, 7 or 8 mer) (green), enriched in optimal codons (top quartile, red) and a control set of maternal genes that do not follow any of the described criteria (gray). P‐values are indicated for the comparisons shown with the colored dots (Wilcoxon rank‐sum test).
qRT–PCR analysis for predicted optimal (red) and non‐optimal (blue) transcripts relative to the controls (cdk2ap2 and taf15). IK cytokine, constitutive heat shock protein 90 (hsp90ab), tRNA methyltransferase 12 homolog (trmt12), and Hermansky–Pudlak syndrome 4 (hps4). Results are shown as the average expression ± standard deviation from three biological replicates (top panel) and six biological replicates (bottom panel) (Mo, embryos were injected with a morpholino complementary to the translation start site of the endogenous mRNA). *P < 0.0001 compared to 2 h (top panel). *P < 0.005 compared to uninjected embryos (bottom panel).
Schematic representing the maternal mRNA decay dynamics and the transcript groups analyzed.
Bar plot representing relative codon distributions between the most unstable (quartile) and the most stable (quartile, n = 1,458) maternal mRNAs in wild‐type, α‐amanitin‐, and cycloheximide (CHX)‐treated embryos. Codons were sorted by their CSC value (Fig 1D). P‐values are indicated for the comparisons between enrichment/depletion in each condition and CSC (Spearman rank test). Optimal codons were highlighted in red and non‐optimal in blue (light, weak; dark, strong, as Fig 1F). Note the depletion of optimal (red) and enrichment of non‐optimal (blue) codons in unstable mRNAs in wild‐type and α‐amanitin‐treated embryos but not in CHX‐treated embryos, consistent with a translation‐mediated mechanism of maternal mRNA decay through codon optimality.
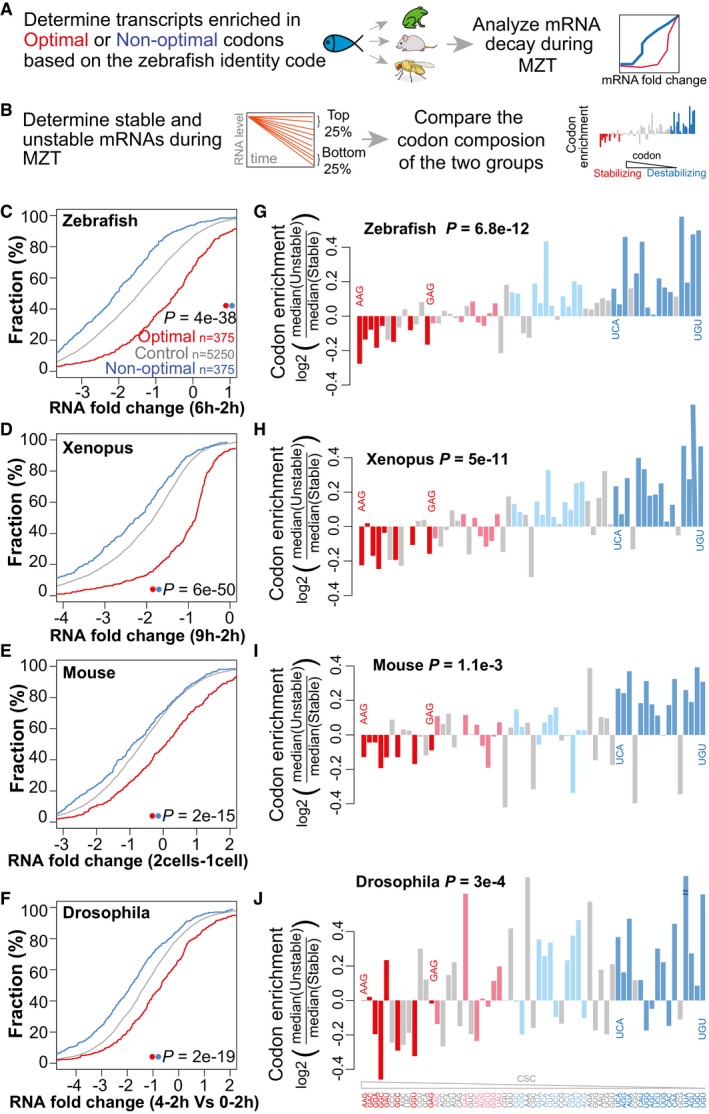
- A
Schematic representation of the analysis workflow for the panels (C–F). Optimal and non‐optimal transcripts are predicted based on the zebrafish optimality code (Fig 1F) and mRNA decay during the MZT in each species was analyzed.
- B
Schematic representation of the analysis workflow for the panels (G–J). The top and bottom quartiles of mRNAs, ranked by stability during the MZT were determined for each species. The codon composition of each group was compared and correlated with the codon optimality defined in zebrafish (CSC).
- C–F
Cumulative distributions of mRNA fold change for optimal (red), non‐optimal (blue), and control transcripts across zebrafish (C), Xenopus (D), mouse (E), and Drosophila (F).
- G–J
Codon enrichment/depletion between the most unstable (quartile) and the most stable (quartile, n = 1,500) maternal mRNAs during the MZT in zebrafish (G), Xenopus (H), mouse (I), and Drosophila (J). Most optimal codons (red: light, weak; dark, strong) are depleted, and non‐optimal (blue: light, weak; dark, strong) codons are enriched in unstable mRNAs compared to stable ones. P‐values are indicated for the comparisons between enrichment/depletion in each species and codon optimality defined in zebrafish (CSC) (Spearman rank test).
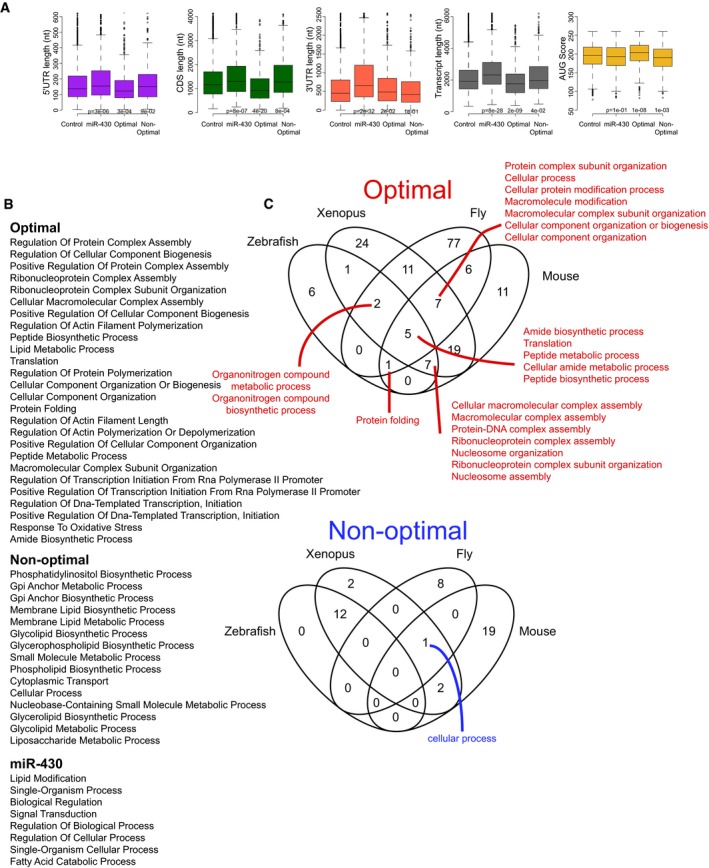
Box plot showing different transcript features of genes enriched in optimal codons, in non‐optimal codons and genes with predicted miR‐430 target sites. For example, miR‐430 targets have significantly longer 3′UTRs. The box defines the first and third quartiles, with the median indicated with a thick black line and vertical lines indicate the variability outside the upper and lower quartiles.
Enrichment for Gene ontology functions among optimal, non‐optimal, and miR‐430 target sites genes.
Gene ontology functions enriched in orthologous genes in zebrafish, Xenopus, mouse, and Drosophila that share the same level of optimality.
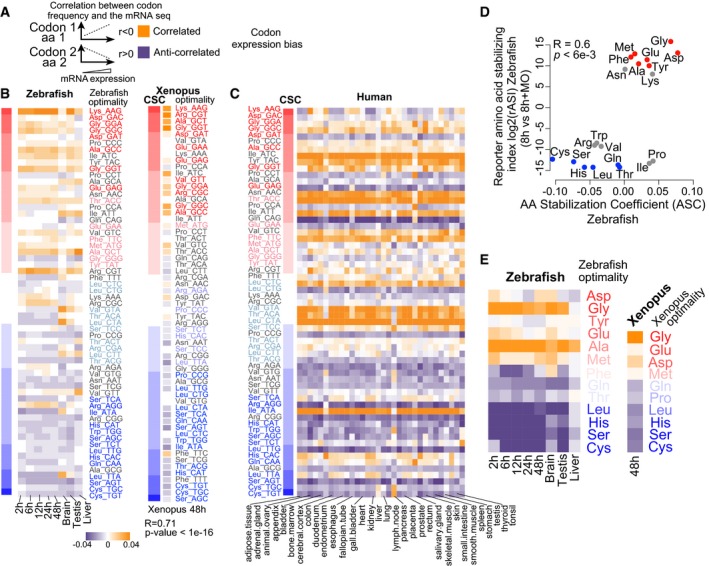
Diagram explaining how codon/amino acid expression bias was computed: Correlation was calculated between the frequency of each codon/amino acid and mRNA levels per gene. Orange means correlation and purple anticorrelation.
Heatmap showing the codon expression bias across the transcriptome for different developmental time points (2, 6, 12, 24 and 48 hpf) and adult organs in zebrafish and Xenopus at 48 h (right). The codon optimality and CSC calculated during embryogenesis are shown to the right (red, optimal to blue, non‐optimal). Heatmap shows the correlation of codon occurrence and Xenopus mRNA expression at 48 h. On the left, a heat map (red‐blue) shows the CSC values for zebrafish and Xenopus. The codons are sorted by their CSC values. For most tissues, optimal codons are correlated with highly expressed genes (orange), while non‐optimal codons are anticorrelated with high levels of expression (purple). We also observe a correlation between mRNA expression and the CSC across different samples (2 h: P = 1e‐07 R = 0.6, 6 h: P = 2e‐16 R = 0.7, 12 h: P = 3e‐09 R = 0.6, 24 h: P = 2e‐07 R = 0.6, 48 h: P = 1e‐07 R = 0.6, brain: P = 1e‐04 R = 0.4, testis: P = 1e‐07 R = 0.6, liver: P = 1e‐03 R = 0.4, Spearman rank test).
Heatmap of the codon composition bias showing the correlation between the CSC in zebrafish (left) with gene expression across 32 human tissues. The codon optimality is labeled as in (B).
Biplots of the reporter amino acid stabilizing index (rASI) comparing 8 h versus 8 h + MO and amino acid stabilization coefficient (ASC) in zebrafish embryos, P < 6e‐3, R = 0.6, Spearman rank correlation. Based on the consistent identification by both methods, we defined optimal amino acids highlighted in red and non‐optimal amino acids in blue.
Heatmap showing the amino bias across the transcriptome for different developmental time points (2, 6, 12, 24 and 48 hpf) and adult organs in zebrafish, and Xenopus at 48 h (right). The optimal and non‐optimal amino acids are shown to the right (red, optimal to blue, non‐optimal).
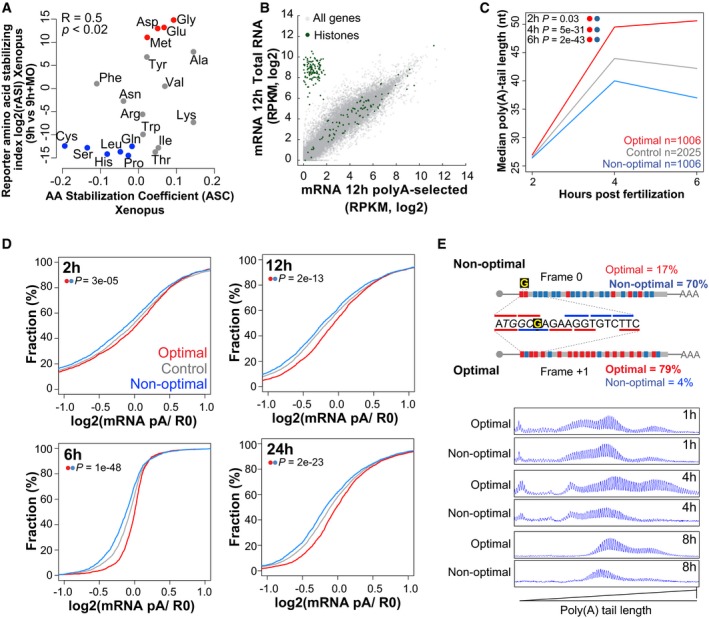
Biplots of the reporter amino acid stabilizing index (rASI) comparing 9 h versus 9 h + MO and amino acid stabilization coefficient (ASC) in Xenopus embryos, P < 0.02, R = 0.5, Spearman rank correlation. Based on the consistent identification by both methods, we defined optimal amino acids highlighted in red and non‐optimal amino acid in blue.
Scatter plot showing expression levels (log2 RPKM) of purified poly(A) mRNA and total RNA at 12 hpf. Histone genes (that lack a poly(A) tail) are highlighted in green.
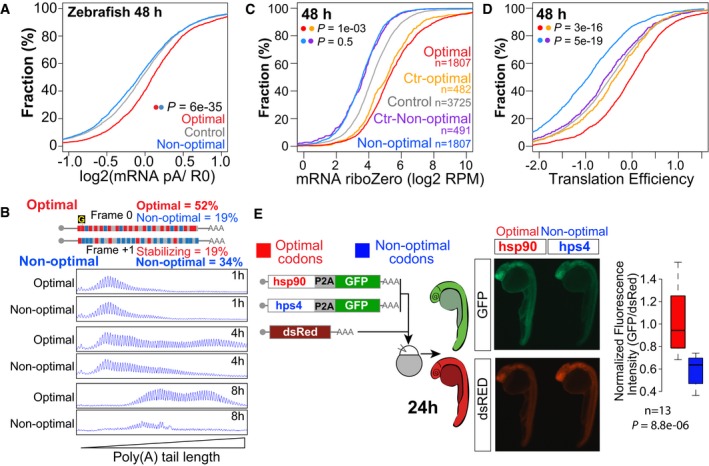
Line plot showing the poly(A) tail length of control mRNAs (gray) based on PAL‐seq data, mRNAs enriched in optimal codons (red), or in non‐optimal (blue) at 2, 4, and 6 hpf (P = 0.03, P = 5e‐31, P = 2e‐43, Wilcoxon rank‐sum test, respectively).
Cumulative distributions of the ratio of purified poly(A)+/total RNA for genes enriched in optimal codons (red) (n = 1,943 at 2 h, 1,791 at 6 h, 2,207 at 12 h, and 2,469 at 24 h) or non‐optimal codons (blue) (n = 1,941 at 2 h, 1,790 at 6 h, 2,208 at 12 h, and 2,462 at 24 h) or genes that were not included in any of the other two groups (gray) at 2, 6, 12, and 24 hpf (P = 3e‐05, P = 1e‐48, P = 2e‐13, P = 2e‐23, Wilcoxon rank‐sum test, respectively).
Single nucleotide resolution electrophoresis for poly(A) length for two sets of transcripts that only differ in a single nucleotide insertion G, but contains opposite codon optimality due to a change in the reading frame (Fig EV2E). This result shows that at 1 h the poly(A) tail length of both constructs is similar; however, by 4 and 8 h the length of the poly(A) tail is shorter in the transcript enriched for non‐optimal codons.
- A
Cumulative distributions of the ratio of poly(A) selected and a total RNA at 48 hpf.
- B
Single nucleotide resolution electrophoresis for poly(A) tail length for two sets of transcripts that only differ in a single nucleotide insertion (“G”), but contain opposite codon optimality due to a change in the reading frame (Fig 1I).
- C, D
Total mRNA (C) and translation efficiency (D) for genes enriched in non‐optimal codons (n = 2,611) and in optimal codons at 48 hpf (n = 2,612). Control sets of genes that have similar RNA level distributions as each group are shown (purple and yellow, f.g). P‐values are indicated for the comparisons shown with the colored dots (Wilcoxon rank‐sum test). Note how optimal mRNAs have a higher polyadenylation status (A) and translation efficiency than non‐optimal mRNAs (D).
- E
Fluorescence microscopy images of representative embryos at 24 hpf expressing a bicistronic reporter encoding an optimal or non‐optimal coding sequence followed by a cis‐acting hydrolase elements (P2A; CHYSEL) and GFP. P2A causes ribosome skipping, what allows us to use GFP as a readout of the translation of the upstream polypeptide. dsRed mRNA is co‐injected as a control, and it is shown below. The level of GFP is higher in the optimal reporter (hsp90) than the non‐optimal one (hps4). Box plot displays fluorescence quantification of 24‐h embryos injected with each reporter. GFP fluorescence intensity was normalized to dsRed intensity in each embryo, n = 13 pairs, P = 8.8e‐06, Wilcoxon rank‐sum test. The box defines the first and third quartiles, with the median indicated with a thick black line and vertical lines indicate the variability outside the upper and lower quartiles.
- A
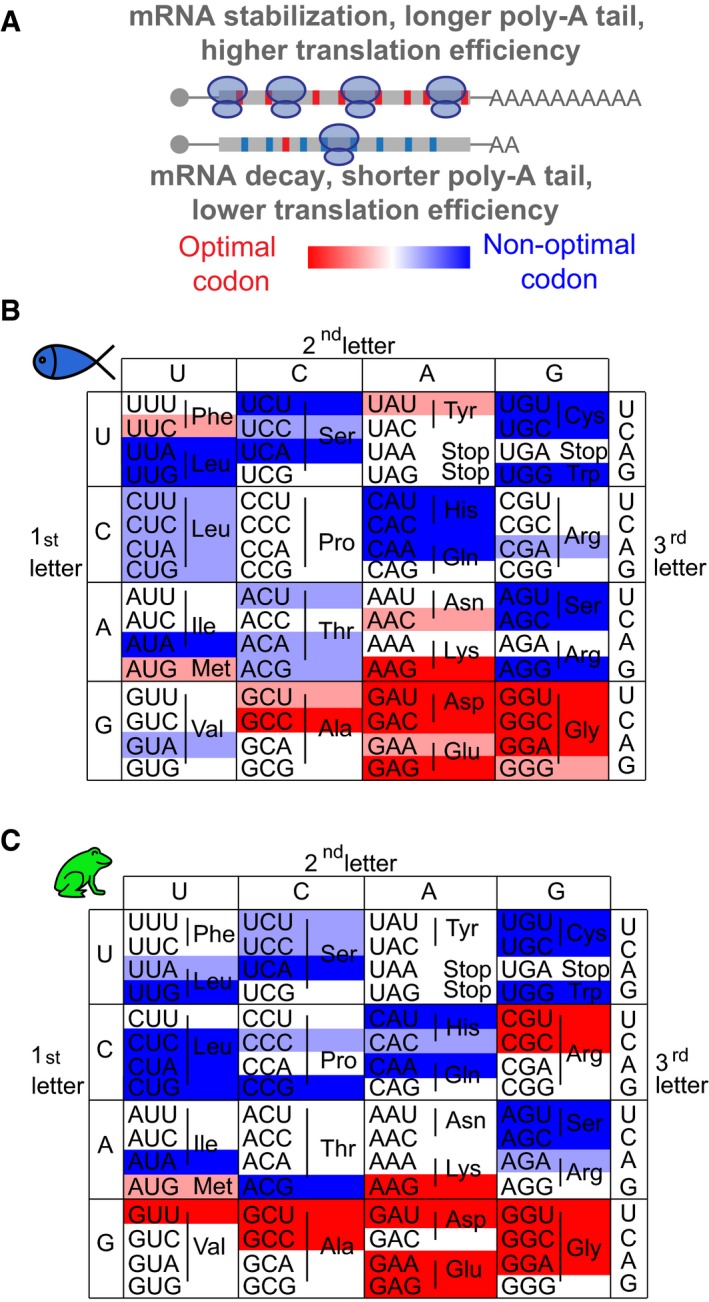
mRNAs enriched in optimal (red) codons have longer poly(A) tails, higher translation efficiency (TE), and higher stability compared to genes enriched in non‐optimal codons (blue).
- B, C
Heatmap showing the codon optimality code underlying the genetic code in zebrafish (B) and Xenopus (C). Based on the consistent identification by two methods (rCSI and CSC), we defined optimal codons in red and non‐optimal codons in blue. The intensity of the color represents the strength (light, weak; dark, strong) based on different CSC values, which corresponds to different cumulative effects in mRNA half‐life (Fig 1F).
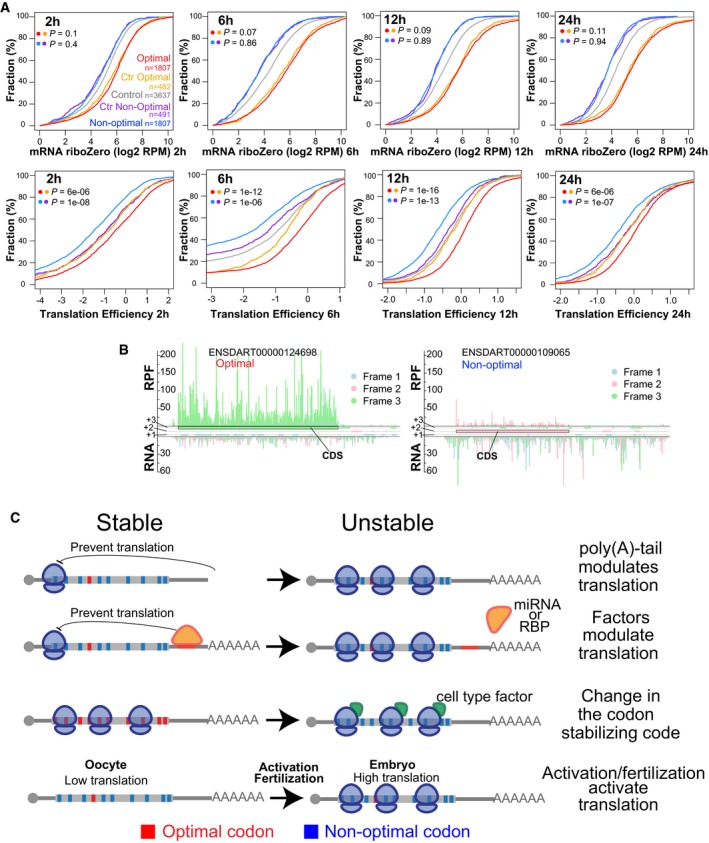
Cumulative distributions of mRNA levels and translation efficiency at 2, 6, 12, and 24 hpf for genes enriched in optimal (red) or non‐optimal codons (blue). Also plotted are two control sets of genes that have similar RNA level distribution to those enriched in optimal or non‐optimal codons (yellow for optimal and purple for non‐optimal), and the rest of the analyzed genes (gray). Number of analyzed genes and P‐values obtained after comparing the cumulative distribution between of the experimental set and the control set as indicated by the colors, Wilcoxon rank‐sum test.
Subcodon profile plot showing ribosome protected fragments (RPF) and input reads (total RNA) aligned to each of the transcripts shown. Reads are colored based on the frame (1, 2, or 3) position relative to the transcript. All putative ORFs (distal AUG‐Stop) were also colored for each respective frame (blue, pink, and green boxes). The annotated ORF is marked. Note that the scale for both transcripts is the same. The gene enriched in optimal codons presents a higher translation efficiency because contain a higher ration of RPF/RNA than the gene enriched in non‐optimal codons.
Speculative model representing how different factors could modulate mRNA expression due to codon optimality. The length of the poly(A) tail as well as factors such microRNA or RNA binding protein can modulate translation and consequently modulate the effects of codon optimality on mRNA stability. Alternatively, specific cellular factors may affect the codon optimality code and so change the gene expression across tissues by modifying mRNA stability. For example, in the oocyte the level of translation is low. After egg activation and/or fertilization translation is activated, consequently a gene enriched in non‐optimal codons may become unstable after translation is activated.
Comment in
-
A code within a code: how codons influence mRNA stability.EMBO J. 2016 Oct 4;35(19):2064-2065. doi: 10.15252/embj.201695283. Epub 2016 Aug 25. EMBO J. 2016. PMID: 27562506 Free PMC article.
-
A Universal Code for mRNA Stability?Trends Genet. 2016 Nov;32(11):687-688. doi: 10.1016/j.tig.2016.08.007. Epub 2016 Sep 1. Trends Genet. 2016. PMID: 27594172 Free PMC article.
References
-
- Ashburner M, Ball CA, Blake JA, Botstein D, Butler H, Cherry JM, Davis AP, Dolinski K, Dwight SS, Eppig JT, Harris MA, Hill DP, Issel‐Tarver L, Kasarskis A, Lewis S, Matese JC, Richardson JE, Ringwald M, Rubin GM, Sherlock G (2000) Gene ontology: tool for the unification of biology. The Gene Ontology Consortium. Nat Genet 25: 25–29 - PMC - PubMed
Publication types
MeSH terms
Substances
Grants and funding
- R21 HD073768/HD/NICHD NIH HHS/United States
- UL1 TR001863/TR/NCATS NIH HHS/United States
- R01 GM037949/GM/NIGMS NIH HHS/United States
- R37 GM037951/GM/NIGMS NIH HHS/United States
- R01 GM103789/GM/NIGMS NIH HHS/United States
- R01 HD081379/HD/NICHD NIH HHS/United States
- R01 GM101108/GM/NIGMS NIH HHS/United States
- R01 GM037951/GM/NIGMS NIH HHS/United States
- R01 GM081602/GM/NIGMS NIH HHS/United States
- T32 GM007499/GM/NIGMS NIH HHS/United States
- R01 GM102251/GM/NIGMS NIH HHS/United States
- R01 HD074078/HD/NICHD NIH HHS/United States
LinkOut - more resources
Full Text Sources
Other Literature Sources
Molecular Biology Databases
