

Visual assessment of the similarity between a patient and trial population: Is This Clinical Trial Applicable to My Patient?
- PMID: 27437055
- PMCID: PMC4941854
- DOI: 10.4338/ACI-2015-12-RA-0178
Visual assessment of the similarity between a patient and trial population: Is This Clinical Trial Applicable to My Patient?
Abstract
Background: A critical consideration when applying the results of a clinical trial to a particular patient is the degree of similarity of the patient to the trial population. However, similarity assessment rarely is practical in the clinical setting. Here, we explore means to support similarity assessment by clinicians.
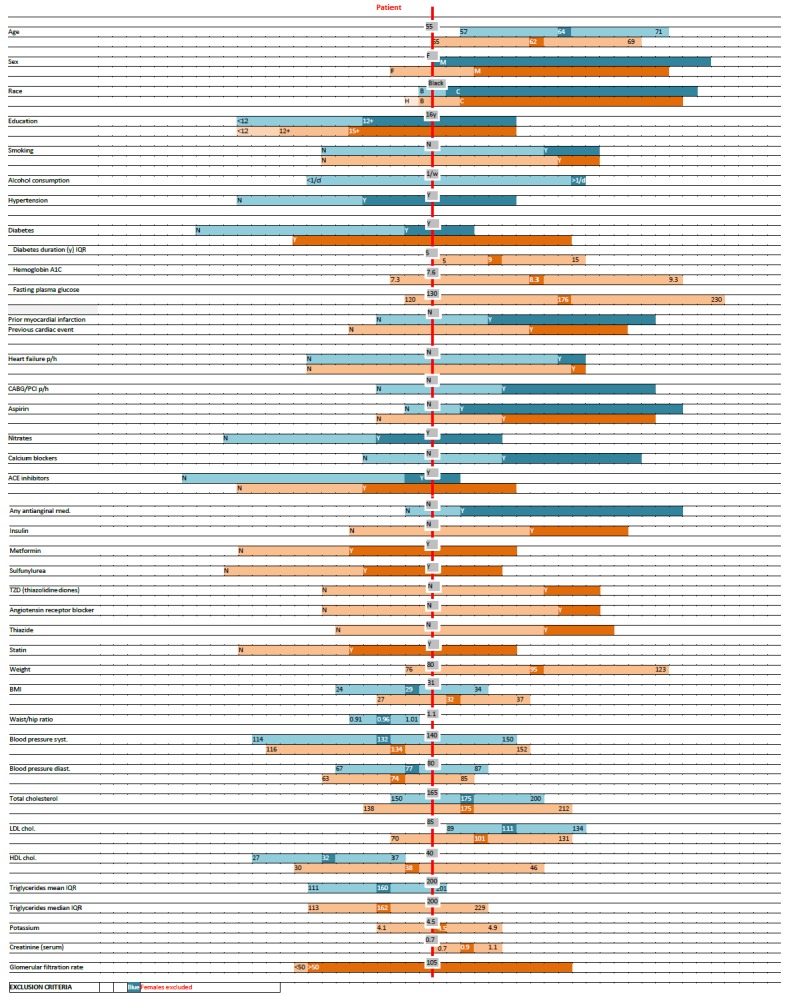
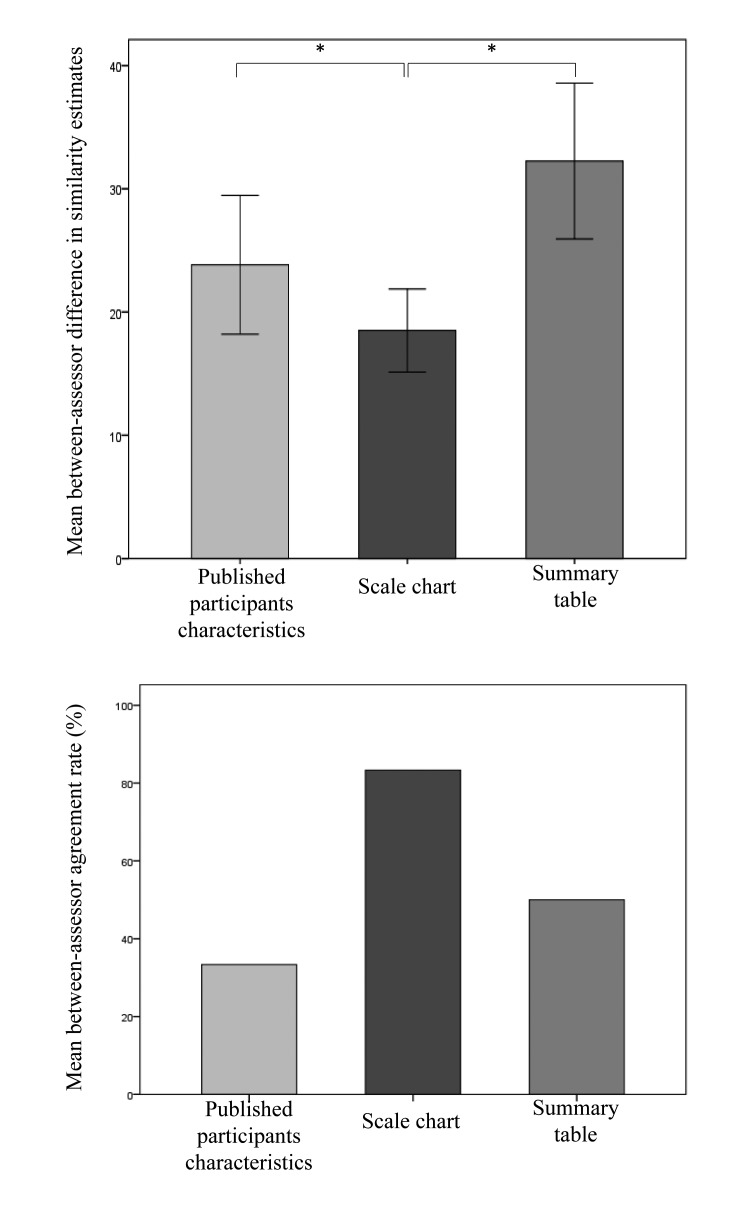
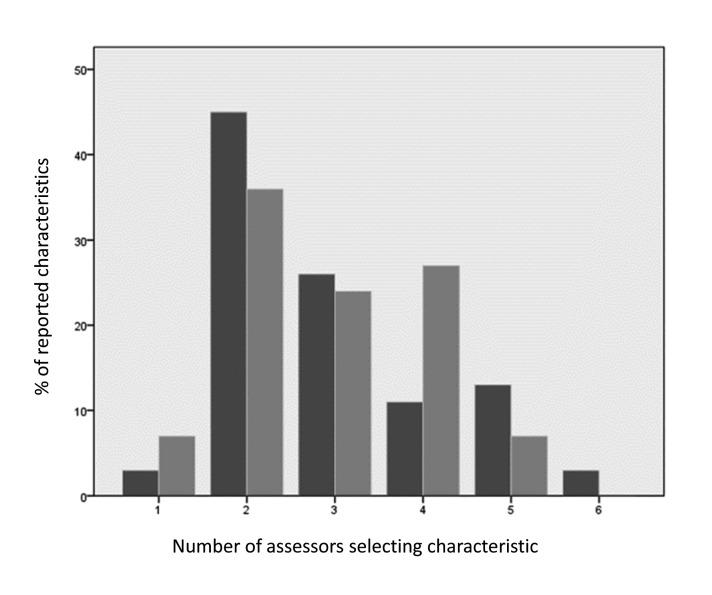
Methods: A scale chart was developed to represent the distribution of reported clinical and demographic characteristics of clinical trial participant populations. Constructed for an individual patient, the scale chart shows the patient's similarity to the study populations in a graphical manner. A pilot test case was conducted using case vignettes assessed by clinicians. Two pairs of clinical trials were used, each addressing a similar clinical question. Scale charts were manually constructed for each simulated patient. Clinicians were asked to estimate the degree of similarity of each patient to the populations of a pair of trials. Assessors relied on either the scale chart, a summary table (aligning characteristics of 2 trial populations), or original trial reports. Assessment time and between-assessor agreement were compared. Population characteristics considered important by assessors were recorded.
Results: Six assessors evaluated 6 cases each. Using a visual scale chart, agreement between physicians was higher and the time required for similarity assessment was comparable.
Conclusion: We suggest that further research is warranted to explore visual tools facilitating the choice of the most applicable clinical trial to a specific patient. Automating patient and trial population characteristics extraction is key to support this effort.
Keywords: Data representation; clinical decision support systems; patient similarity; visual scale.
Conflict of interest statement
The authors declare that they have no conflict of interest in the research.
Figures
References
-
- Williamson JW, German PS, Weiss R, Skinner EA, Bowes F. Health science information management and continuing education of physicians. A survey of U.S. primary care practitioners and their opinion leaders. Ann Intern Med 1989; 110(2):151–160. - PubMed
-
- Gupta K, Hooton TM, Naber KG, Wullt B, Colgan R, Miller LG, et al. International clinical practice guidelines for the treatment of acute uncomplicated cystitis and pyelonephritis in women: A 2010 update by the Infectious Diseases Society of America and the European Society for Microbiology and Infectious Diseases. Clin Infect Dis Off Publ Infect Dis Soc Am 2011; 52(5): e103-e120. doi:10.1093/cid/ciq257. - PubMed
-
- McDonald CJ. Medical heuristics: the silent adjudicators of clinical practice. Ann Intern Med 1996; 124(1 Pt 1): 56–62. - PubMed
-
- Tversky A, Kahneman D. Judgment under Uncertainty: Heuristics and Biases. Science 1974; 185(4157):1124–1131. doi:10.1126/science.185.4157.1124. - PubMed
Publication types
MeSH terms
LinkOut - more resources
Full Text Sources
Other Literature Sources
Medical
