

Relationship between neuropsychological impairment and grey and white matter changes in adult-onset myotonic dystrophy type 1
- PMID: 27437180
- PMCID: PMC4939389
- DOI: 10.1016/j.nicl.2016.06.011
Relationship between neuropsychological impairment and grey and white matter changes in adult-onset myotonic dystrophy type 1
Abstract
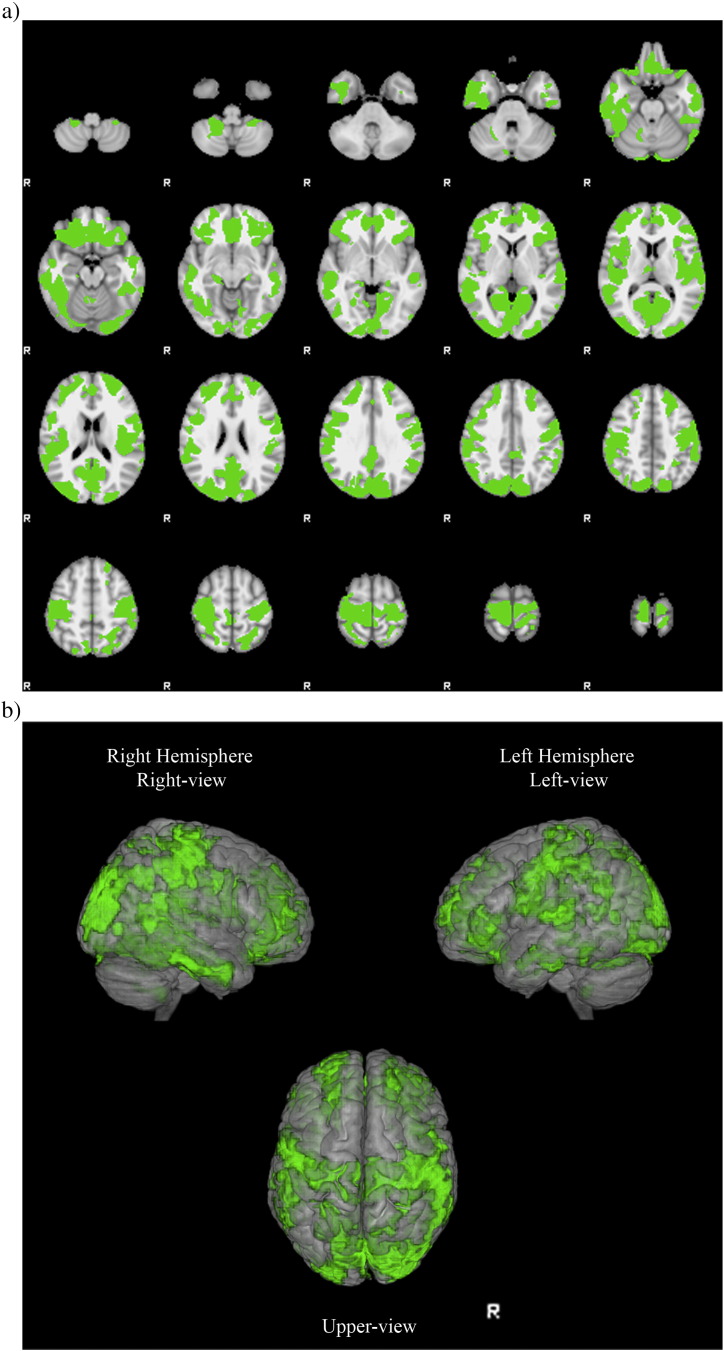
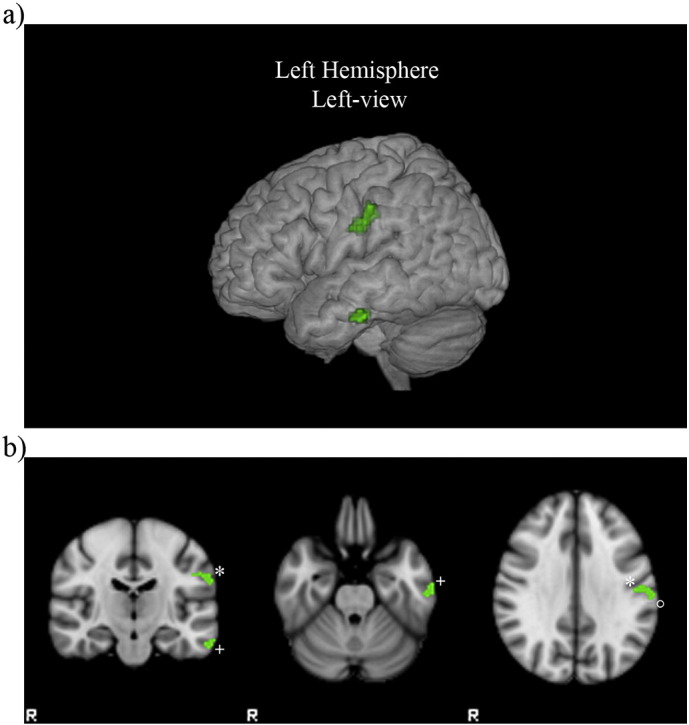
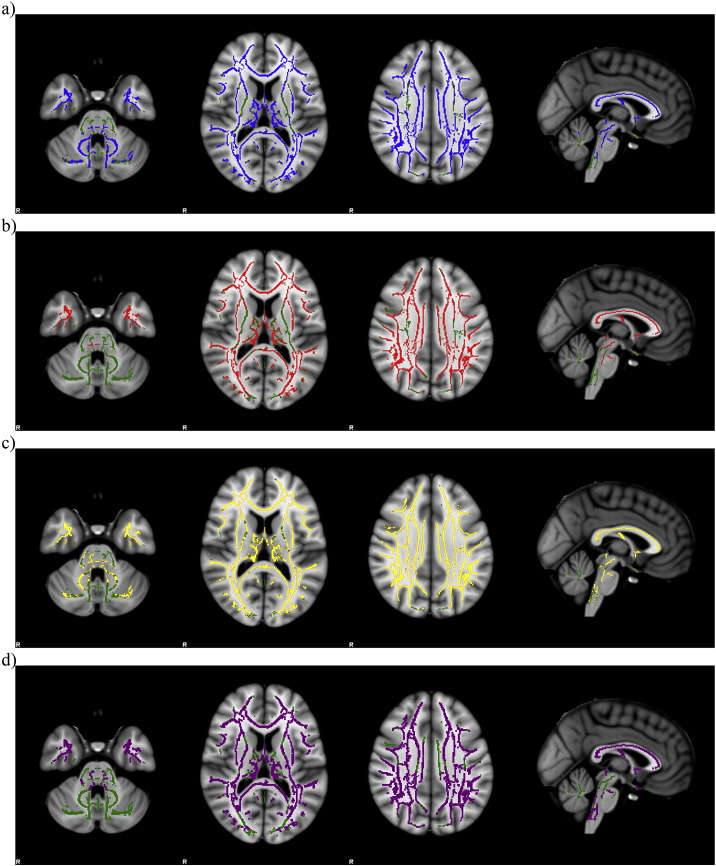
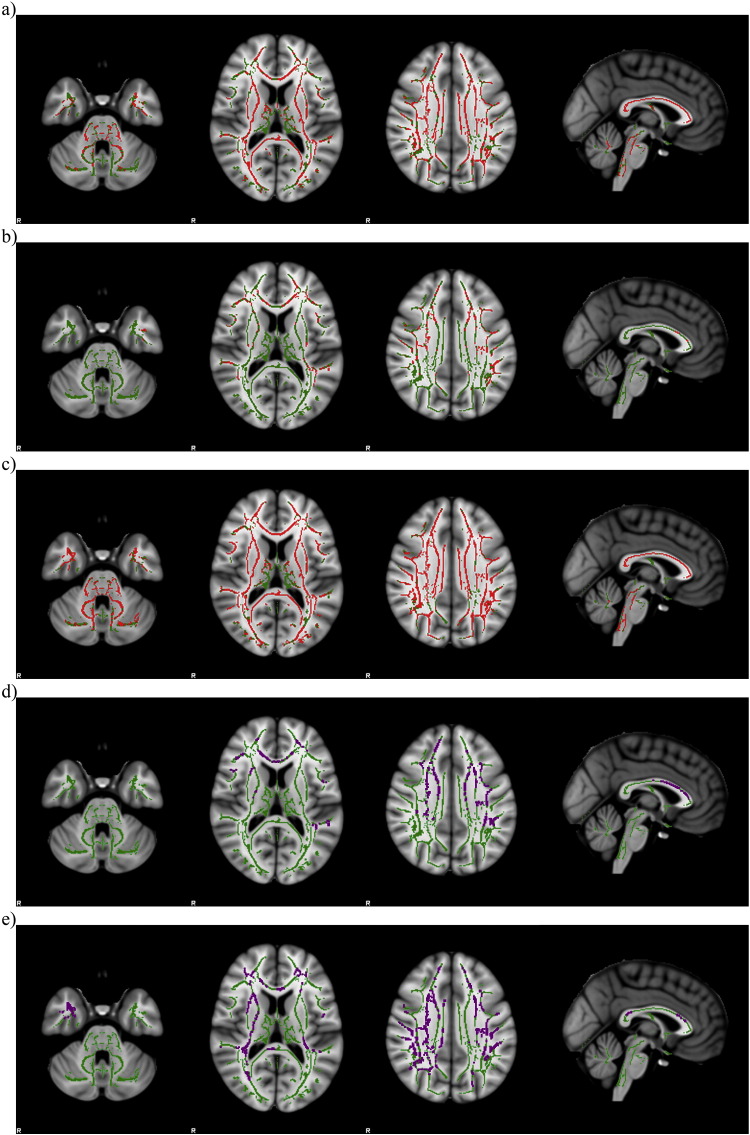
Myotonic dystrophy type 1 (DM1) has a wide phenotypic spectrum and potentially may affect central nervous system with mild to severe involvement. Our aim was to investigate grey matter (GM) and white matter (WM) structural alterations in a sample of adult-onset DM1 patients and to evaluate relationship with clinical and cognitive variables. Thirty DM1 patients underwent neuropsychological investigation and 3T-MRI protocol. GM and WM changes were evaluated calculating brain parenchymal fraction (BPF), voxel-based morphometry (VBM), white matter lesion load (LL% and Fazekas scale) and tract based spatial statistical (TBSS). Patients showed main impairment in tests exploring executive and mnesic domains with visuo-spatial involvement, significantly related to BPF. VBM revealed clusters of widespread GM reduction and TBSS revealed areas of decreased fractional anisotropy (FA) and increased radial diffusivity (RD), mean diffusivity (MD) and axial diffusivity (AD) in patients compared to a group of matched healthy controls. Multiple regression analyses showed areas of significant negative relationship between left temporal atrophy and verbal memory, between RD and mnesic and visuo-spatial cognitive domains, and between AD and verbal memory. TBSS results indicate that the involvement of normal appearance WM, beyond the signal changes detected with conventional MR imaging (Fazekas scale and LL%), was associated with neuropsychological deficit. These data suggest that disrupted complex neuronal networks can underlie cognitive-behavioural dysfunctions in DM1.
Keywords: DM1; MR imaging; Neuropsychology; TBSS; VBM.
Figures
References
-
- Acheson D.J., Hagoort P. Stimulating the brain's language network: syntactic ambiguity resolution after TMS to the inferior frontal gyrus and middle temporal gyrus. J. Cogn. Neurosci. 2013;25:1664–1677. - PubMed
-
- Andersson J.L.R., Jenkinson M., Smith S. 2007. Non-linear Registration, AKA Spatial Normalisation. FMRIB Technical Report TR07JA2. (Available: www.fmrib.ox.ac.uk/analysis/techrep)
-
- Behrens T.E.J., Woolrich M.W., Jenkinson M., Johansen-Berg H., Nunes R.G., Clare S., Matthews P.M., Brady J.M., Smith S.M. Characterization and propagation of uncertainty in diffusion-weighted MR imaging. Magn. Reson. Med. 2003;50:1077–1088. - PubMed
-
- Caramia F., Mainero C., Gragnani F., Tinelli E., Fiorelli M., Ceschin V., Pantano P., Bucci E., Barra V., Bozzao L., Antonini G. Functional MRI changes in the central motor system in myotonic dystrophy type 1. Magn. Reson. Imaging. 2010;28:226–234. - PubMed
Publication types
MeSH terms
LinkOut - more resources
Full Text Sources
Other Literature Sources
Medical
Miscellaneous
