. 2016 Jun;4(2):71-79.
doi: 10.1142/S2339547816400045. Epub 2016 Feb 19.

Dynamic deformability of sickle red blood cells in microphysiological flow

Affiliations

Dynamic deformability of sickle red blood cells in microphysiological flow

Y Alapan et al. Technology (Singap World Sci). 2016 Jun.

Abstract

In sickle cell disease (SCD), hemoglobin molecules polymerize intracellularly and lead to a cascade of events resulting in decreased deformability and increased adhesion of red blood cells (RBCs). Decreased deformability and increased adhesion of sickle RBCs lead to blood vessel occlusion (vaso-occlusion) in SCD patients. Here, we present a microfluidic approach integrated with a cell dimensioning algorithm to analyze dynamic deformability of adhered RBC at the single-cell level in controlled microphysiological flow. We measured and compared dynamic deformability and adhesion of healthy hemoglobin A (HbA) and homozygous sickle hemoglobin (HbS) containing RBCs in blood samples obtained from 24 subjects. We introduce a new parameter to assess deformability of RBCs: the dynamic deformability index (DDI), which is defined as the time-dependent change of the cell's aspect ratio in response to fluid flow shear stress. Our results show that DDI of HbS-containing RBCs were significantly lower compared to that of HbA-containing RBCs. Moreover, we observed subpopulations of HbS containing RBCs in terms of their dynamic deformability characteristics: deformable and non-deformable RBCs. Then, we tested blood samples from SCD patients and analyzed RBC adhesion and deformability at physiological and above physiological flow shear stresses. We observed significantly greater number of adhered non-deformable sickle RBCs than deformable sickle RBCs at flow shear stresses well above the physiological range, suggesting an interplay between dynamic deformability and increased adhesion of RBCs in vaso-occlusive events.

Keywords: Biomechanics; Cell Adhesion; Cell Mechanics; Dynamic Cell Deformation; Microfluidics; Red Blood Cell; Sickle Cell Disease.


Conflict of interest statement

DISCLOSURE OF CONFLICTS OF INTEREST

The authors declare no competing financial interests. Y.A., J.A.L. and U.A.G. filed a patent application pertaining to the results presented in this paper: Patent Cooperation Treaty Application (PCT/US2015/042907): “Biochips to Diagnose Hemoglobin Disorders and Monitor Blood Cells”.

Figures

Figure 1
Figure 1
Microfluidic system for probing red blood cell (RBC) dynamic deformability. (a) Microfluidic system is composed of a poly(methyl methacrylate) (PMMA) cover, a double-sided adhesive (DSA) layer, which defines the channel shape and height (50 μm) and a glass slide base. (b) Microfluidic channels are functionalized with fibronectin, which mimics the microvasculature wall in a closed system and can process whole blood. (c) PMMA top cover in the microfluidic system comprises micromachined inlets and outlets for tubing connections and blood injection. (d) Microfluidic system is placed on an automated microscope stage for live cell image recording.
Figure 2
Figure 2
Automated dimensioning of adhered RBCs in microchannels. Length and width measurements of (a) deformable and (b) non-deformable RBCs. (i) Recorded single RBC images were converted to binary and the intensity threshold was adjusted to the level where the cell border was distinguishable. Vertical (ii) and horizontal (iii) intensity profiles along the binary image, where 0 represents black and 1 represents white. The length and width of the RBCs were determined using the outer edges of the black cell border. (iv) Unprocessed RBC images were cropped to contain the RBC of interest in the frame.
Figure 3
Figure 3
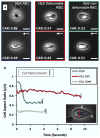
Dynamic deformability analysis of single RBCs containing healthy and sickle hemoglobin in microfluidic channels. (a) Different types of RBCs adhered on fibronectin functionalized surface in the absence of flow and right before detachment in response to applied flow. From left to right, healthy (HbA) RBCs, deformable HbS RBCs and non-deformable HbS RBCs, respectively. Scale bars represent 8 μm (length). Arrows indicate direction of flow. (b) Cell aspect ratio (CAR) change over time for typical HbA, deformable HbS and non-deformable HbS RBCs are shown. The CAR was calculated real-time by dividing the vertical width by the horizontal length (inset, y/x).
Figure 4
Figure 4
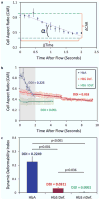
Dynamic deformability of healthy and sickle RBCs. (a) Dynamic deformability index (DDI) is determined as the rate of aspect ratio change in time in response to fluid shear stress. DDI = tan(α), where α is the angle between the change in CAR and the time of interest. (b) Healthy RBCs deformed at a much quicker rate and greater than non-deformable HbS and deformable HbS RBCs. Shown is the average curve for each group during deformation and the grey area indicates the time frame for when the HbA RBCs reached their deformed state. (c) The DDIs of each group were compared for the same amount of time (2 seconds, indicated by the grey area in b). The horizontal lines between individual groups represent statistically significant difference based on Kruskal–Wallis test followed by one-way ANOVA test with Fisher’s posthoc test for multiple comparisons (n = 3–6 cells in a total of 12 blood samples; p < 0.05). Error bars represent standard error of the mean.
Figure 5
Figure 5
Subpopulations of sickle RBCs based on adhesion and deformability in microphysiological flow. (ac) Number of adhered RBCs and morphologies were analyzed at step-wise increased shear stresses of (a) 1 dyne/cm2, (b) 4 dyne/cm2 and (c) 50 dyne/cm2. Deformable (with characteristic biconcave shape) and non-deformable RBCs (without characteristic biconcave shape) were determined based on morphological characterization. Scale bars represent 50 μm and 5 μm (length) in insets, respectively. (d) Number of adhered RBCs were significantly lower at 50 dyne/cm2 shear stress compared to shear stresses of 1 dyne/cm2 and 4 dyne/cm2. (e) Number of adhered non-deformable RBCs at 50 dyne/cm2 shear stress was significantly higher than number of adhered deformable RBCs. The horizontal lines between individual groups represent statistically significant difference based on a one-way ANOVA test with Fisher’s post-hoc test for multiple comparisons (p < 0.05). n represents the number of subjects. Data point crossbars represent the mean and error bars represent the standard error of the mean.

References

    1. Mohandas N, Gallagher PG. Red cell membrane: Past, present, and future. Blood. 2008;112:3939–3948. - PMC - PubMed
    1. Juhan I, et al. Abnormalities of erythrocyte deformability and platelet aggregation in insulin-dependent diabetics corrected by insulin in vivo and in vitro. Lancet. 1982;1:535–537. - PubMed
    1. Diamantopoulos EJ, et al. Impaired erythrocyte deformability precedes vascular changes in experimental diabetes mellitus. Horm Metab Res. 2004;36:142–147. - PubMed
    1. Huang S, et al. Dynamic deformability of Plasmodium falciparum-infected erythrocytes exposed to artesunate in vitro. Integr Biol. 2013;5:414–422. - PMC - PubMed
    1. Glenister FK, Coppel RL, Cowman AF, Mohandas N, Cooke BM. Contribution of parasite proteins to altered mechanical properties of malaria-infected red blood cells. Blood. 2002;99:1060–1063. - PubMed