

Low Temperature Synthesis of Belite Cement Based on Silica Fume and Lime
- PMID: 27437495
- PMCID: PMC4897044
- DOI: 10.1155/2014/873215
Low Temperature Synthesis of Belite Cement Based on Silica Fume and Lime
Abstract
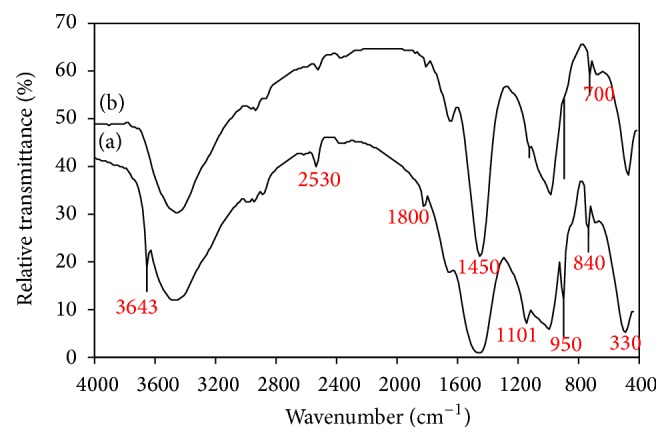
This paper describes the low temperature synthesis of belite (β-C2S) from silica fume. Mixtures of lime, BaCl2, and silica fume with the ratio of (Ca + Ba)/Si = 2 were hydrothermally treated in stainless steel capsule at 110-150°C for 2-5 hours, calcined at 600-700°C for 3 hours, and analyzed by FTIR, XRD, TGA/DTA, and SEM techniques. Dicalcium silicate hydrate (hillebrandite) was prepared by hydrothermal treatment of lime/silica fume mixtures with (Ca + Ba)/Si = 2 at 110°C for 5 hours. Hillebrandite partially dehydrates in two steps at 422 and 508°C and transforms to γ-C2S at 734°C which in turn transforms to α'-C2S at 955°C which in turn transforms to β-C2S when cooled. In presence of Ba(2+) ions, β-C2S could be stabilized with minor transformation to γ-C2S. Mixture of silica fume, lime, and BaCl2 with the ratio of (Ca + Ba)/Si = 2 was successfully utilized for synthesis of β-C2S by hydrothermal treatment at 110°C for 5 hours followed by calcination of the product at 700°C for 3 hours.
Figures


References
-
- Jackson J. P. Portland cement: classification and manufacture. In: Hewlett P. C., editor. Lea’s Chemistry of Cement and Concrete. 4th. Oxford, UK: Butterworth-Heinemann; 2007. p. p. 25.
-
- EIPPCB (European Integrated Pollution Prevention and Control Bureau). Reference Document on Best Available Techniques in Cement, Lime and Magnesium Oxide Manufacturing Industries, European Commission. 2010.
-
- Young J. F., Mindess S. Concrete. Upper Saddle River, NJ, USA: Prentice-Hall; 1981.
-
- Worrell E., Price L., Martin N., Hendriks C., Meida L. O. Carbon dioxide emissions from the global cement industry. Annual Review of Energy and the Environment. 2001;26:303–329. doi: 10.1146/annurev.energy.26.1.303. - DOI
-
- Van Oss H. G., Padovani A. C. Cement manufacture and the environment. Part II. Environmental challenges and opportunities. Journal of Industrial Ecology. 2003;7(1):93–126. doi: 10.1162/108819803766729212. - DOI
LinkOut - more resources
Full Text Sources
Other Literature Sources
Research Materials
