Gene expression profile comparison in the penile tissue of diabetes and cavernous nerve injury-induced erectile dysfunction rat model
- PMID: 27437539
- PMCID: PMC4949699
- DOI: 10.4111/icu.2016.57.4.286
Gene expression profile comparison in the penile tissue of diabetes and cavernous nerve injury-induced erectile dysfunction rat model
Abstract
Purpose: To investigate the effects of cavernous nerve injury (CNI) on gene expression profiles in the cavernosal tissue of a CNI-induced erectile dysfunction (ED) model and to provide a basis for future investigations to discover potential target genes for ED treatment.
Materials and methods: Young adult rats were divided randomly into 2 groups: sham operation and bilateral CN resection. At 12 weeks after CNI we measured erectile responses and performed microarray experiments and gene set enrichment analysis to reveal gene signatures that were enriched in the CNI-induced ED model. Alterations in gene signatures were compared with those in the diabetes-induced ED model. The diabetic-induced ED data is taken from GSE2457.
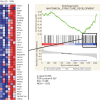
Results: The mean ratio of intracavernosal pressure/blood pressure for the CNI group (0.54±0.4 cmH2O) was significantly lower than that in the sham operation group (0.73±0.8 cmH2O, p<0.05). Supervised and unsupervised clustering analysis showed that the diabetes- and CNI-induced ED cavernous tissues had different gene expression profiles from normal cavernous tissues. We identified 46 genes that were upregulated and 77 genes that were downregulated in both the CNI- and diabetes-induced ED models.
Conclusions: Our genome-wide and computational studies provide the groundwork for understanding complex mechanisms and molecular signature changes in ED.
Keywords: Erectile dysfunction; Gene expression; Microarray analysis; Peripheral nerve injuries.
Conflict of interest statement
Figures


Similar articles
-
Effectiveness of intracavernous delivery of adenovirus encoding Smad7 gene on erectile function in a mouse model of cavernous nerve injury.J Sex Med. 2014 Jan;11(1):51-63. doi: 10.1111/jsm.12329. Epub 2013 Sep 25. J Sex Med. 2014. PMID: 24433558
-
A mouse model of cavernous nerve injury-induced erectile dysfunction: functional and morphological characterization of the corpus cavernosum.J Sex Med. 2010 Oct;7(10):3351-64. doi: 10.1111/j.1743-6109.2010.01942.x. J Sex Med. 2010. PMID: 20646178
-
Intracavernous delivery of clonal mesenchymal stem cells restores erectile function in a mouse model of cavernous nerve injury.J Sex Med. 2014 Feb;11(2):411-23. doi: 10.1111/jsm.12380. Epub 2013 Nov 20. J Sex Med. 2014. PMID: 24251583
-
[Treatment of erectile dysfunction caused by cavernous nerve injury: An update].Zhonghua Nan Ke Xue. 2019 Oct;25(10):928-933. Zhonghua Nan Ke Xue. 2019. PMID: 32233226 Review. Chinese.
-
Neuroprotective and Nerve Regenerative Approaches for Treatment of Erectile Dysfunction after Cavernous Nerve Injury.Int J Mol Sci. 2017 Aug 18;18(8):1794. doi: 10.3390/ijms18081794. Int J Mol Sci. 2017. PMID: 28820434 Free PMC article. Review.
Cited by
-
The effects of single versus combined therapy using LIM-kinase 2 inhibitor and type 5 phosphodiesterase inhibitor on erectile function in a rat model of cavernous nerve injury-induced erectile dysfunction.Asian J Androl. 2019 Sep-Oct;21(5):493-500. doi: 10.4103/aja.aja_114_18. Asian J Androl. 2019. PMID: 30829289 Free PMC article.
-
Identification of biomarkers for chronic renal fibrosis and their relationship with immune infiltration and cell death.Ren Fail. 2025 Dec;47(1):2449195. doi: 10.1080/0886022X.2024.2449195. Epub 2025 Jan 8. Ren Fail. 2025. PMID: 39780495 Free PMC article.
-
Pathway Enrichment Analysis of Microarray Data Fom Human Penis of Diabetic and Peyronie's Patients, in Comparison With Diabetic Rat Erectile Dysfunction Models.J Sex Med. 2022 Jan;19(1):37-53. doi: 10.1016/j.jsxm.2021.10.004. Epub 2021 Nov 25. J Sex Med. 2022. PMID: 34838480 Free PMC article.
-
Restoration of Cavernous Veno-Occlusive Function through Chronic Administration of a Jun-Amino Terminal Kinase Inhibitor and a LIM-Kinase 2 Inhibitor by Suppressing Cavernous Apoptosis and Fibrosis in a Rat Model of Cavernous Nerve Injury: A Comparison with a Phosphodiesterase Type 5 Inhibitor.World J Mens Health. 2021 Jul;39(3):541-549. doi: 10.5534/wjmh.200085. Epub 2020 Jul 9. World J Mens Health. 2021. PMID: 32777863 Free PMC article.
-
Pericyte-derived heme-binding protein 1 promotes angiogenesis and improves erectile function in diabetic mice.Investig Clin Urol. 2022 Jul;63(4):464-474. doi: 10.4111/icu.20220038. Investig Clin Urol. 2022. PMID: 35796141 Free PMC article.
References
-
- Jemal A, Siegel R, Xu J, Ward E. Cancer statistics, 2010. CA Cancer J Clin. 2010;60:277–300. - PubMed
-
- Noldus J, Michl U, Graefen M, Haese A, Hammerer P, Huland H. Patient-reported sexual function after nerve-sparing radical retropubic prostatectomy. Eur Urol. 2002;42:118–124. - PubMed
-
- Sanda MG, Dunn RL, Michalski J, Sandler HM, Northouse L, Hembroff L, et al. Quality of life and satisfaction with outcome among prostate-cancer survivors. N Engl J Med. 2008;358:1250–1261. - PubMed
-
- User HM, Hairston JH, Zelner DJ, McKenna KE, McVary KT. Penile weight and cell subtype specific changes in a post-radical prostatectomy model of erectile dysfunction. J Urol. 2003;169:1175–1179. - PubMed
-
- Mullerad M, Donohue JF, Li PS, Scardino PT, Mulhall JP. Functional sequelae of cavernous nerve injury in the rat: is there model dependency. J Sex Med. 2006;31:77–83. - PubMed
Publication types
MeSH terms
LinkOut - more resources
Full Text Sources
Other Literature Sources
Medical
Molecular Biology Databases

