. 2016 Aug 4;536(7614):81-85.
doi: 10.1038/nature18930. Epub 2016 Jul 20.

Synchronized cycles of bacterial lysis for in vivo delivery

Affiliations

Synchronized cycles of bacterial lysis for in vivo delivery

M Omar Din et al. Nature. .

Abstract

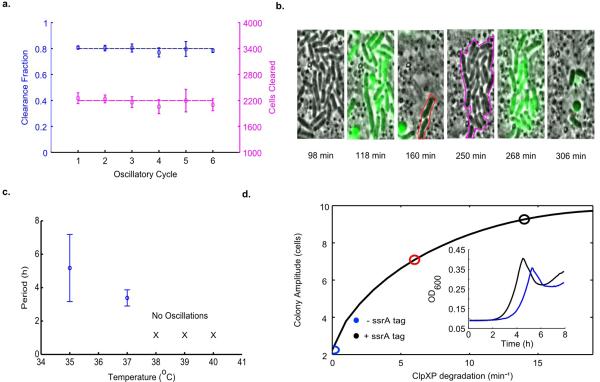
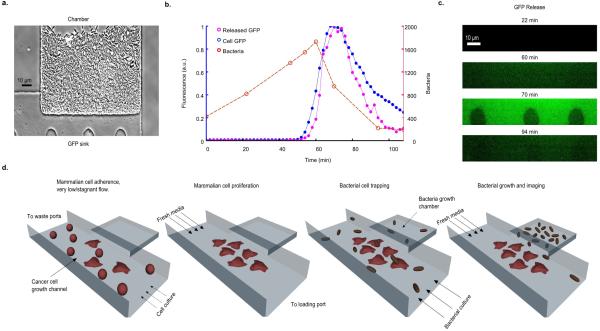
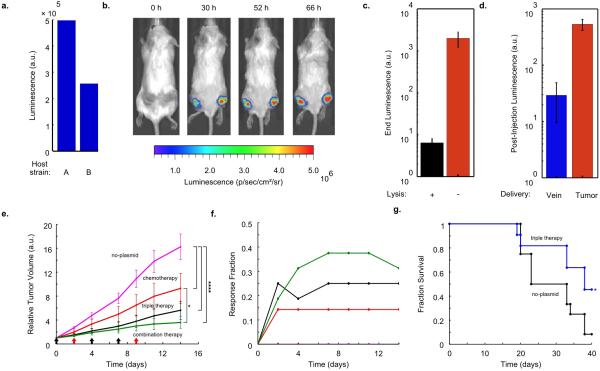
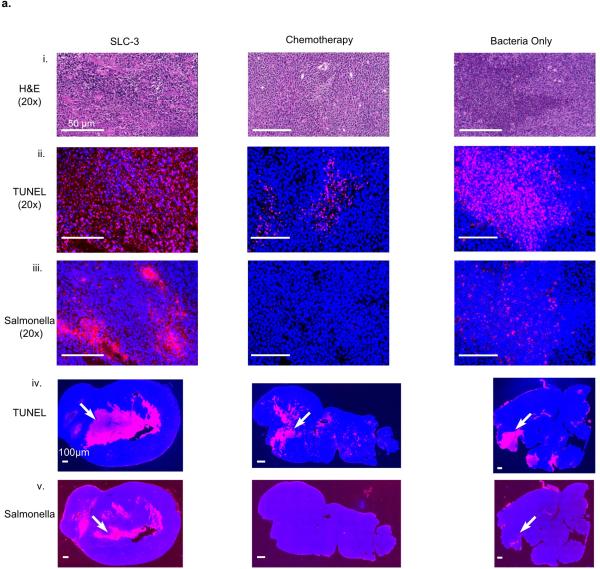
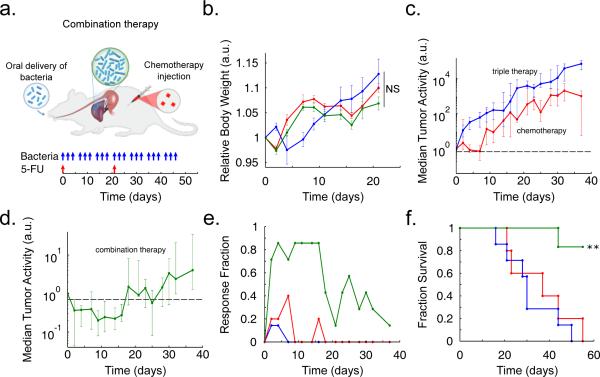
The widespread view of bacteria as strictly pathogenic has given way to an appreciation of the prevalence of some beneficial microbes within the human body. It is perhaps inevitable that some bacteria would evolve to preferentially grow in environments that harbor disease and thus provide a natural platform for the development of engineered therapies. Such therapies could benefit from bacteria that are programmed to limit bacterial growth while continually producing and releasing cytotoxic agents in situ. Here we engineer a clinically relevant bacterium to lyse synchronously ata threshold population density and to release genetically encoded cargo. Following quorum lysis, a small number of surviving bacteria reseed the growing population, thus leading to pulsatile delivery cycles. We used microfluidic devices to characterize the engineered lysis strain and we demonstrate its potential as a drug delivery platform via co-culture with human cancer cells in vitro. Asa proof of principle, we tracked the bacterial population dynamics in ectopic syngeneic colorectal tumours in mice via a luminescent reporter. The lysis strain exhibits pulsatile population dynamics in vivo, with mean bacterial luminescence that remained two orders of magnitude lower than an unmodified strain. Finally, guided by previous findings that certain bacteria can enhance the efficacy of standard therapies, we orally administered the lysis strain alone or in combination with a clinical chemotherapeutic to a syngeneic mouse transplantation model of hepatic colorectal metastases. We found that the combination of both circuit-engineered bacteria and chemotherapy leads to a notable reduction of tumour activity along with a marked survival benefit over either therapy alone.Our approach establishes a methodology for leveraging the tools of synthetic biology to exploit the natural propensity for certain bacteria to colonize disease sites.


Figures

Extended Data Fig. 1
Various properties of the SLC. (a) The fraction and number of bacterial cells cleared per consecutive oscillatory cycle in the growth chamber for a typical microfluidic experiment for S. typhimurium, including the effects of lysis and flow of cells outside of the trap (Strain 1). (b) Subset of time series images from the experiment in (a) showing a portion of the growth chamber where survivors of the initial lysis event (160 min frame, red outline) produce progeny (250 min frame, magenta outline) which are lysis sensitive. (c) Period as a function of the environmental temperature for E. coli (Strain 13). The circuit does not oscillate for temperatures above 37°C in E. coli. Error bars indicate ±1 standard deviation for 12 - 19 peaks. (d) Colony amplitude at quorum firing for increasing degradation on the LuxI activator protein in the computational model. These simulation results are supported by batch well-plate experiments of the LuxI ssrA (black line, Strain 2) and non-ssrA (blue line, Strain 1) tagged versions of the circuit in S. typhimurium (inset).
Extended Data Fig. 2
Investigating lysis mediated intracellular release. (a) A bacterial growth chamber with a 0.4μm sink for sfGFP visualization after release. (b) Number of bacteria (red line), bacterial fluorescence (blue line), sink fluorescence (pink line) for a typical oscillatory cycle (Strain 1). (c) Fluorescence time series images of the microfluidic sink from (b). (d) General procedure for performing bacterial and cancer cell co-culture experiments in a microfluidic device (also see Supplementary Information).
Extended Data Fig. 3
In vivo expression and therapy testing. (a) End-point in vitro luminescence intensity for SLC strains after ~20 h of growth. Host strains A and B are the host bacteria for Strains 8 and 10. They are ELH1301 and ELH 430, respectively. Host A exhibits ~2-fold higher luminescence with the same circuit than Host B. (b) IVIS imaging over time of a mouse bearing subcutaneous tumors injected with a genomically integrated constitutively luminescent strain (Strain 9). (c) End-point in vivo bacterial luminescence of the SLC-hly strain and the constitutively luminescent strain from the experiments presented in Fig. 4. Error bars represent the standard error of the mean bacterial luminescence from 9 tumors. (d) Post-injection in vivo bacterial luminescence for the constitutively luminescent strain administered intravenously (vein) or intratumorally (tumor). Luminescence was measured ~20 h post-injection. Error bars represent the standard error of the mean bacterial luminescence from 6 and 9 tumors for the intravenous and intratumoral cases, respectively. (e) Average relative tumor volume over time for subcutaneous tumor bearing mice injected with the no-plasmid bacterium (Strain 7), 5-FU chemotherapy, the SLC-3 strains, and the combination of SLC-3 with chemotherapy. Bacteria were injected intratu-morally on days 0, 4, and 7 (black arrows), and chemotherapy was administered on days 2 and 9 (red arrows) (*P < 0.05, ****P < 0.0001, two-way ANOVA with Bonferroni post test, n = 12 - 16 tumors, s.e.). (f) Fraction of mice from the cases in (e) which respond with 30% reduction of tumor volume over time. (g) Fraction survival over time for mice with hepatic colorectal metastases fed with either the SLC-3 strains (blue line) or the no-plasmid control (black line) (*P < 0.05, log rank test; n = 11 - 12 mice).
Extended Data Fig. 4
(a) Histology of tumor sections taken from mice with different treatments 3 days post administration: (i) H and E staining for tissue sections intravenously injected with a combination of therapeutic bacteria (SLC-3), chemotherapy (5-FU), or a bacteria control with no therapeutic (Strain 7). (ii) TUNEL staining (red) in the same sections indicating cell apoptosis. (iii) Salmonella immunohistochemistry (red) in the same sections confirming presence of bacteria in tumors. Scale bars for (i), (ii), and (iii) denote 50μm. (iv) and (v) TUNEL and Salmonella staining (red) in the entire tumor sections (examples indicated by arrows). Scale bars for (iv) and (v) denote 100μm. DAPI staining (blue) was used to obtain a measure of live and dead cells in (ii) - (iv). Histology slices (n=6) from 20x images were compared across the groups and mean intensity of TUNEL staining, normalized by sample area, was demonstrated to be significantly higher for SLC-3 compared to the other two groups (P<0.0001, one-way ANOVA), and not significantly different between the chemotherapy and bacteria only cases.
Extended Data Fig. 5
Shown are the main plasmids used in this study (see Supplementary Information for more details).
Fig. 1
Fig. 1
Construction and characterization of the SLC. (a) The circuit contains an activator and lysis plasmid. When the population reaches the quorum threshold at a critical AHL concentration, the luxI promoter drives the transcription of gene E for lysis, LuxI, and sfGFP or luxCDABE as the reporter module. The luxI or the ptac promoter also drives the transcription of the therapeutic gene for the stabilized circuit used in vivo. LuxR in this system is driven by the native pLuxR promoter. (b) A schematic that illustrates the main stages of each lysis cycle from seeding to quorum ‘firing’. Shown below are typical time series images of the circuit-harboring cells undergoing the three main stages of quorum firing in a microfluidic growth chamber. (c) Fluorescence profile of a typical microfludic experiment. The estimated cell population trajectory reveals that lysis events correspond to peaks of sfGFP fluorescence. (d) Period as a function of estimated flow velocity in the media channel of the microfluidic device and environmental temperature. Error bars indicate ±1 standard deviation for 13 - 50 peaks. The above experiments were performed with Strain 1, see Supplementary Information for complete strain information.
Fig. 2
Fig. 2
Computational modeling and tunability. (a) The model consists of intracellular variables (lysis gene E and LuxI concentrations) and extracellular variables (colony size and AHL concentrations). A time series of colony size (black line), colony AHL (blue line), intracellular LuxI (green line) and lysis protein concentrations (red line) are shown on the right. (b) The region in the model parameter space for clpXP mediated degradation (see Supplementary information) and flow where the model output is oscillatory increases with higher production and degradation terms. (c) Results from the computational model showing the ability to tune the oscillatory period by varying ClpXP mediated degradation of LuxI. (d) Fluorescence profiles showing lysis oscillations for LuxI ssrA (black line, Strain 2) and non-ssrA (blue line, Strain 1) tagged versions of the circuit. See Supplementary Information for complete model information.
Fig. 3
Fig. 3
In vitro co-culture. (a) Schematic of the microfluidic co-culture with cancer cells and bacteria. Fluidic resistance was modified in this chip to achieve stable near-stagnant flow reduction to allow for cancer cell adherence and for diffusion of released therapeutic from the trap to the channel (methods in Supplementary Information). (b) Frames from the co-culture time series sequentially visualizing S. typhimurium (Strain 3) ‘firing’, lysis, and HeLa cell death. (c) Fluorescent profile of the bacteria and HeLa cell viability fraction (# live cells / # dead cells in image frames) from (b) with time. (d) % viability of HeLa cells co-cultured with supernatant from S. typhimurium culture harboring the SLC + HlyE (Strain 4), the SLC only (Strain 5), constitutive hlyE only (Strain 6), or no plasmid (Strain 7). Error bars indicate ±1 standard error averaged over three measurements. (e) Fluorescence profile of the SLC + HlyE (Strain 4) co-cultured with HeLa cells at various initial seeding densities. The black ‘x’ marks the point of complete HeLa cell death. (f) The toxin exposure time, measured from the initial presence of fluorescence to HeLa cell death, as a function of the sfGFP production rate (see example in (e)). Although the time to death depends on seeding, the total magnitude of exposure remains conserved (inset). Error bars indicate ±1 standard error for three measurements. See Supplementary Information for ELH1301 host strain information.
Fig. 4
Fig. 4
In vivo bacterial dynamics, tumor impact, and tolerability in a subcutaneous tumor model. (a) IVIS imaging over time of a mouse bearing two hind flank tumors injected once with the stabilized SLC-hly strain (Strain 8). (b) Single tumor density map trajectories of bacterial luminescence (relative to luminescence at 0h) for the SLC-hly strain (Strain 8). Data for each axis represents separate experiments. (c) Single tumor density map trajectories of bacterial luminescence for the genomically integrated constitutively luminescent strain (Strain 9). Intratumoral injection resulted in over 35-fold higher post-injection luminescence compared to intravenous injection (Extended Data Fig. 3d). (d) Average relative tumor volume over time for subcutaneous tumor bearing mice injected with SLC-hly (red line, Strain 10), SLC-cdd (green line, Strain 14), SLC-ccl21 (blue line, Strain 15), and all together (SLC-3) (black line). Bacteria were injected intratumorally on days 0, 2, 6, 8, and 10 (black arrows) (****P < 0.0001, two-way ANOVA with Bonferroni post test, n = 14 - 17 tumors, s.e.). (e) Average relative tumor volume over time for mice with subcutaneous tumors injected with the SLC-3 strains (black line, Strain 10, 14, and 15) and the no-plasmid control (magenta line, Strain 7). Bacteria were injected intratumorally on days 0, 2, 6, and 10 (black arrows) (****P < 0.0001, two-way ANOVA with Bonferroni post test, n = 18 - 19 tumors, s.e.). (f) Average relative body weight over time for mice with subcutaneous tumors injected with the SLC-3 strains (black line, Strain 10, 14, and 15) and the no-plasmid control (magenta line, Strain 7). Bacteria were injected intratumorally on days 0, 2, 6, and 10 (black arrows) (n=10 mice for both cases, s.e.). (g) Average relative body weight over time for subcutaneous tumor-bearing mice with a single intravenous injection of the SLC + constitutive hlyE (turquoise line, n=9 mice, Strain 11), a non-SLC strain with constitutive hlyE (orange line, n=5 mice, Strain 12), or the no-plasmid control strain (magenta line, n=9 mice, Strain 7) (***P < 0.001, two-way ANOVA with Bonferroni post test, s.e.).
Fig. 5
Fig. 5
In vivo testing in an experimental model of colorectal metastases in the liver via oral delivery of bacteria. (a) Schematic of the experimental syngeneic transplantation model of hepatic colorectal metastases in a mouse, with the dosing schedule of either engineered bacteria (SLC-3) or a common cytotoxic chemotherapeutic, the antimetabolite 5-FU. The SLC-3 strains were delivered orally while 5-FU was delivered via intraperitoneal injection. (b) Relative body weight over time for the mice with with hepatic colorectal metastases fed with the SLC-3 strains (blue line), injected with 5-FU chemotherapy (red line), or a combination of the two (green line). Error bars indicate ±1 standard error for 5 - 7 mice. (c) Median relative tumor activity, measured via tumor cell luminescence using IVIS imaging, for the chemotherapy and SLC-3 cases from (b). (d) Median relative tumor activity for the combination therapy case from (b). Error bars for (c) and (d) indicate the interquartile ranges for 5 - 7 mice. The dashed line marks relative tumor activity of 0.70. (e) Fraction of mice from the cases in (b) which respond with 30% reduction of tumor activity over time. (f) Fraction survival over time for the mice in (b) (**P < 0.01, log rank test; n = 5 - 7 mice).

Comment in

References

    1. Cho I, Blaser MJ. The human microbiome: at the interface of health and disease. Nature Reviews Genetics. 2012;13:260–270. - PMC - PubMed
    1. Xuan C, et al. Microbial dysbiosis is associated with human breast cancer. PloS one. 2014;9:e83744. - PMC - PubMed
    1. Fischbach MA, Bluestone JA, Lim WA. Cell-based therapeutics: the next pillar of medicine. Science translational medicine. 2013;5:179ps7. 179ps7. - PMC - PubMed
    1. Pawelek JM, Low KB, Bermudes D. Tumor-targeted Salmonella as a novel anticancer vector. Cancer research. 1997;57:4537–4544. - PubMed
    1. Ruder WC, Lu T, Collins JJ. Synthetic biology moving into the clinic. Science. 2011;333:1248–1252. - PubMed

Publication types

MeSH terms